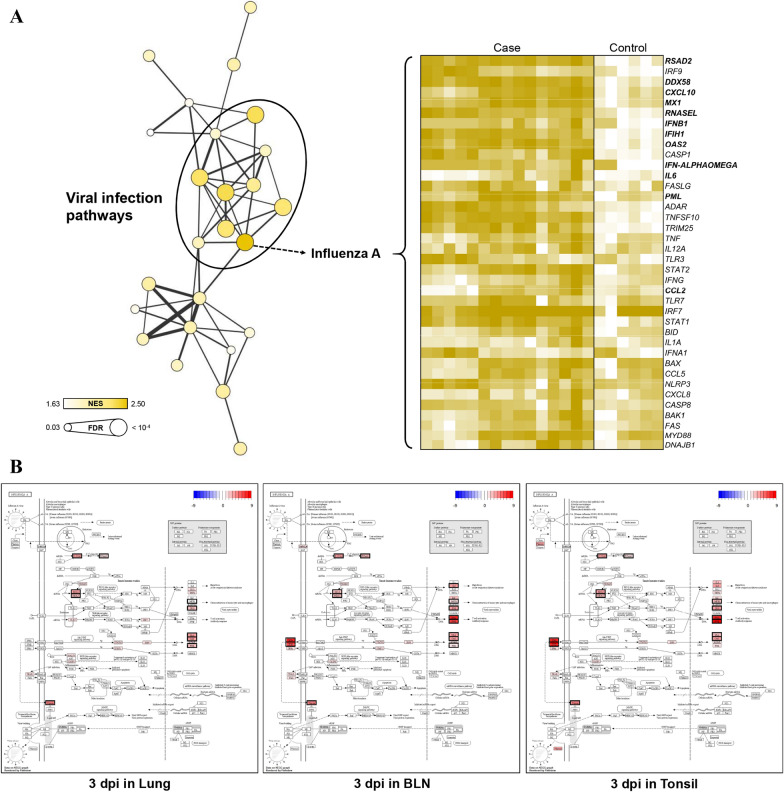
Figure 5.
GSEA results and gene modulations related to KEGG pathways at 3 dpi. A An enrichment map (node: pathway, edge: similarity coefficient between gene sets) was built based on significant pathways (FDR < 0.05), and a heatmap was generated using the core enriched genes in the pathway with the highest NES (influenza A). B Genes overlapping with the GCN are shown in bold. Expression changes at 3 dpi in the influenza A pathway are presented as log2 FC values for each tissue.
Data information: Proteins corresponding to the DEGs involved in the GCN are indicated with a black border.

