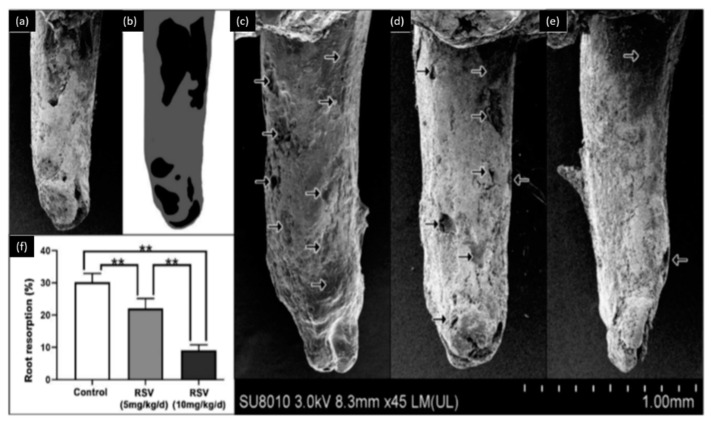
Figure 2.
Observation of root resorption. (a) SEM image of the tooth, (b) root resorption area (black) and the total surface area (grey), (c) representative SEM pictures of the control group, (d) 5 mg/kg/d resveratrol group, (e) 10 mg/kg/d resveratrol group, (f) the resorption ratio of the three groups were calculated by dividing the surface of black area by the grey area. (** p < 0.01, n = 6). Modified from ref. [54] with authorization.

