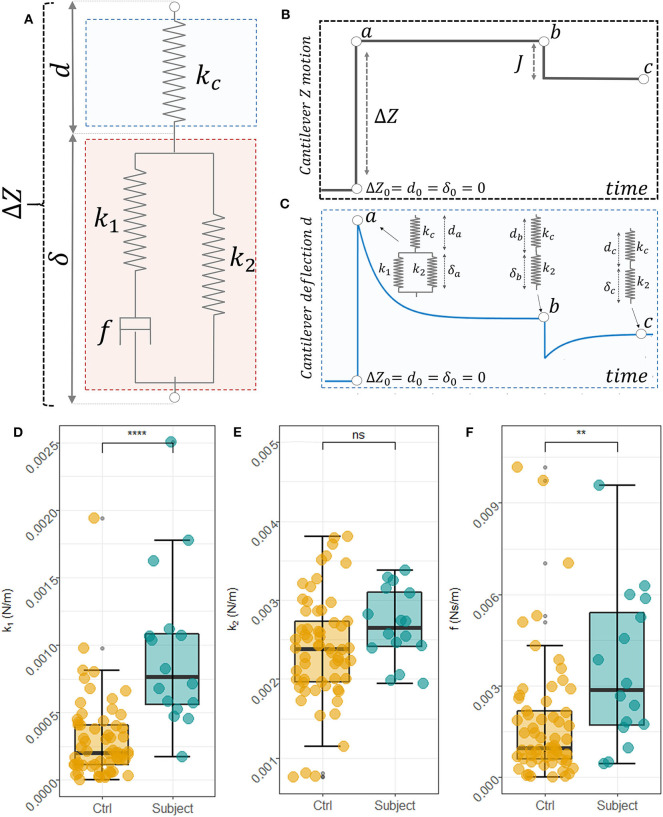
Figure 2.
Scheme of the SLS model used to describe RBCs mechanical behavior and interaction with AFM (A). Schematic view of the cantilever position overtime during the measurements (B) and the corresponding cantilever deflection (C). In the specific equilibrium points point a, b, and c the mechanical behavior of the sample and the cantilever is represented in the insets of (C). Box plot analysis of the obtained SLS parameters, namely k1 (D), k2 (E), and the f (F) for control subjects and the pathological one. An unpaired two-samples Mann Whitney U-Test was used to compare data.

