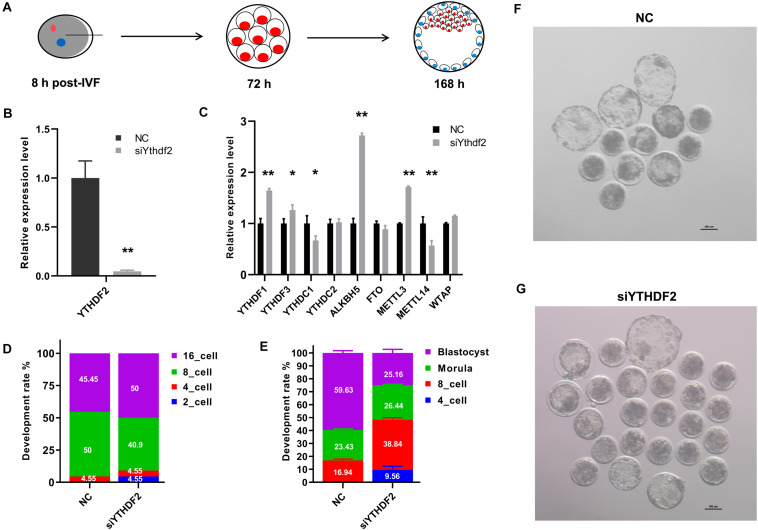
FIGURE 3.
Knockdown of YTHDF2 impaired goat early embryo development. (A) Schematic diagram of the YTHDF2 knockdown experiment. (B) The expression of YTHDF2 was significantly decreased in YTHDF2 knocked down embryos at the 8-cell stage, as revealed by qPCR. (C) The expression of m6A-related genes in YTHDF2 knocked down embryos. (D,E) The developmental rate at 72 h and 168 h after YTHDF2 siRNA injection. (F,G) Representative images of embryos in NC (n = 52) and YTHDF2 knocked down group (n = 71) at 168 h after siRNA injection.

