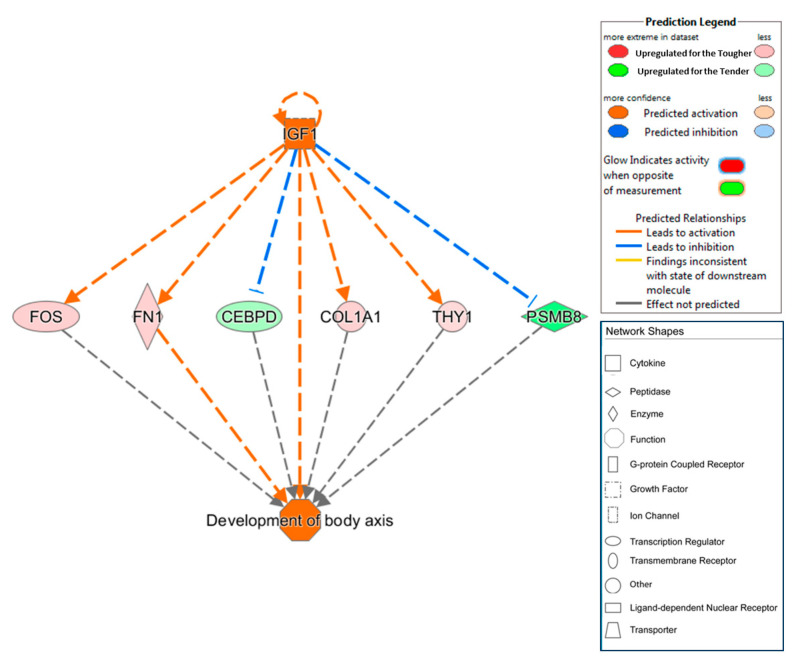
Figure 3.
Regulator effects network predicted as activated in purebred Iberian pigs fattened in a free-range system. In the upper tier is IGF1 (predicted to be activated, orange color). In the middle, there are the genes whose expression changes in response to the activation of IGF1 (green upregulated for the Tender group and red upregulated for the Tough group). Dashed lines between IGF1 and DEGs represent the interactions, predicted to be activated (orange lines) or predicted to be inhibited (blue lines). In the lower tier, the expected phenotypic activate function (development of body axis, orange color) is shown.

