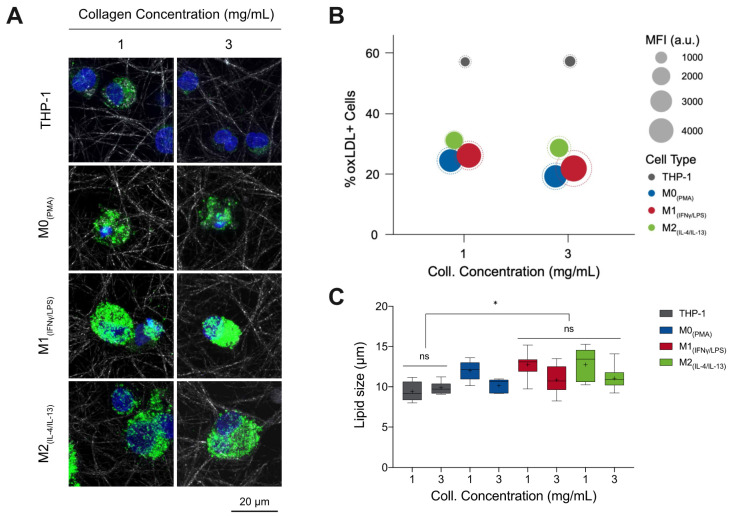
Figure 1.
oxLDL uptake by monocytes and macrophages in 3D collagen matrices. (A) Representative confocal images of monocytes and macrophages with DiI-oxLDL uptake. (B) In this infographic, the number of oxLDL+ cells (y-axis) was greatest in THP-1 (grey) followed by M2 (green) macrophages, then M1 (red), and finally M0 (blue). The amount of oxLDL in the cells, as quantified through mean fluorescence intensity (MFI, solid circle) (circle size, see legend), was greatest in M1 macrophages, followed by M0, then M2, and finally THP-1. The dotted circle is the corresponding standard deviation of the MFI. A sample size of 5 was performed for each condition. (C) Lipid droplet size as measured from images obtained with confocal microscopy using a custom-built image analysis toolbox. Data were shown as a boxplot (whiskers represent minimum and maximum, + represents the mean, line inside each box plot represents the median). Significance is represented as * p < 0.05 between samples in 1 mg/mL collagen concentration.

