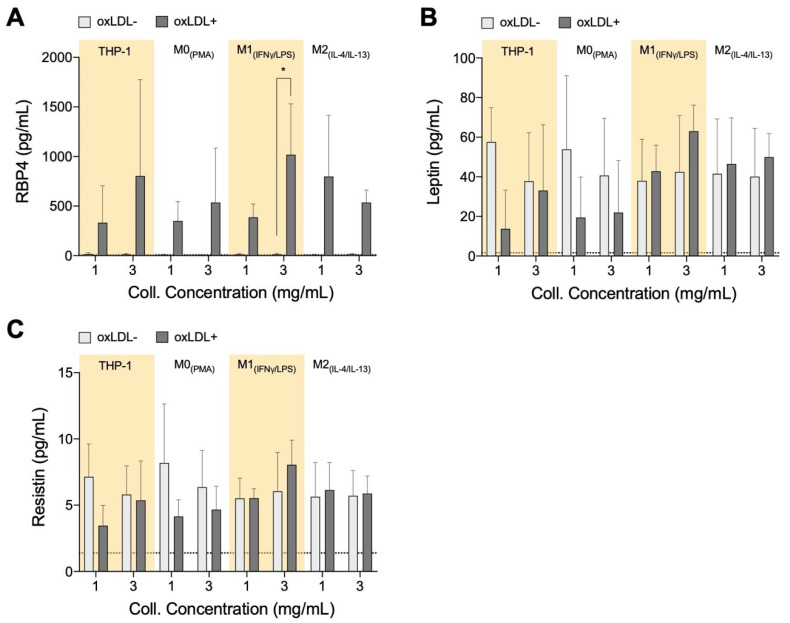
Figure 3.
Adipokine secretome from monocytes and macrophages cultured in 3D collagen hydrogels. Box plots of absolute secretion levels of (A) RBP4, (B) leptin, and (C) resistin to observe trends and indicate comparisons that are statistically significant. The dotted line in the box plots marks the lowest detectable concentration of assay. Statistical significance has been determined by two-way ANOVA followed by Tukey’s test, and the level of significance is represented as * p < 0.05, significantly higher than the untreated sample at the same matrix density condition, no significance otherwise.

