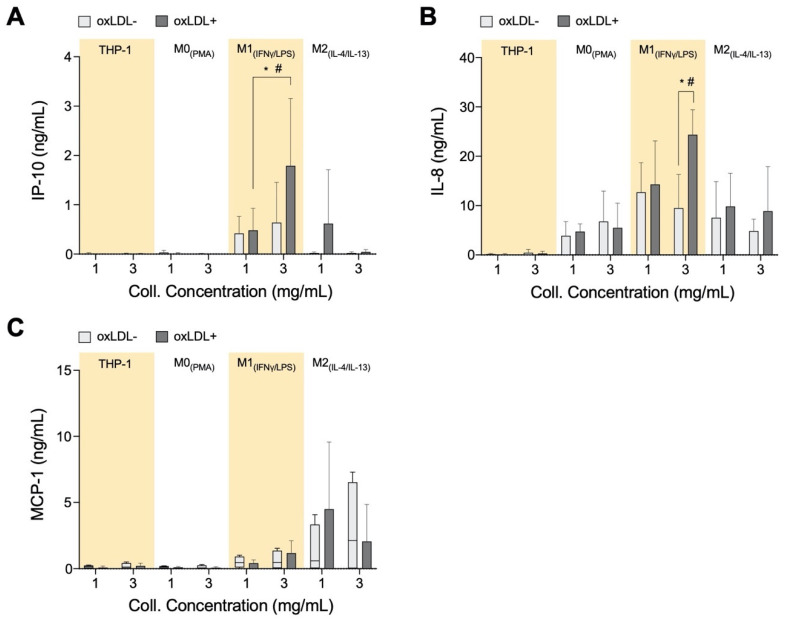
Figure 4.
Chemokine secretome from monocytes and macrophages cultured in 3D collagen hydrogels. Box plots of absolute secretion levels of (A) IP-10, (B) IL-8, and (C) MCP-1 to observe trends and indicate comparisons that are statistically significant. The dotted line in box plots marks the lowest detectable concentration of assay. Statistical significance has been determined by two-way ANOVA followed by Tukey’s test, and the level of significance is represented as * p < 0.05 and # p < 0.05 in 3 mg/mL between THP-1+LDL, M0+LDL, and M2+LDL vs. M1+LDL. The dotted horizontal line indicates the lowest detectable limits of the assay.

