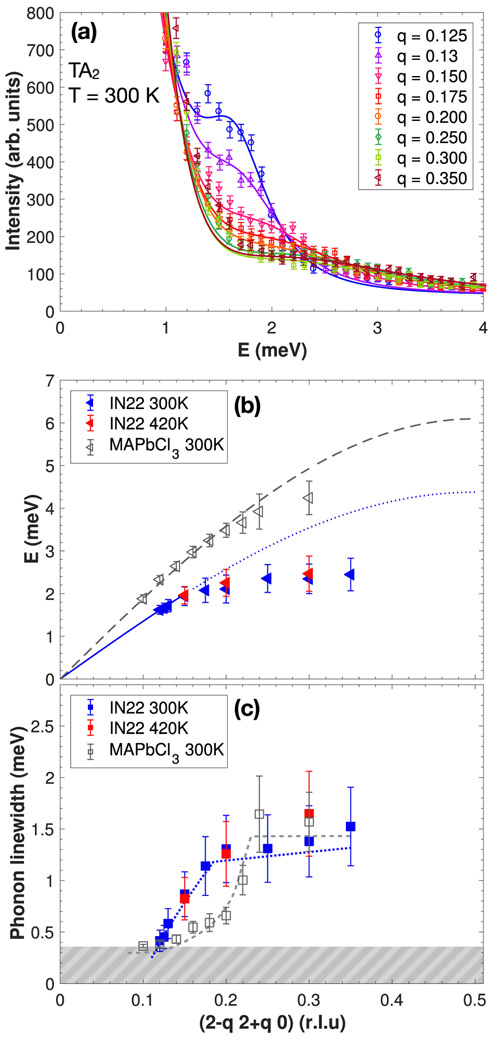
FIG. 3.
(a) Constant-Q cuts through the acoustic phonon TA2 for several Q positions from the (2 2 0) Bragg peak towards the M point. (b) Dispersion curves associated with the TA2 mode towards the M point. The data is compared to the organic-inorganic compound CH3NH3PbCl3 in its cubic phase (gray triangles, from Ref. [1]). The blue and gray dashed lines are a fit to a sine function performed near the q → 0 limit. (c) Q dependence of the TA2 phonon linewidths extracted from the constant-Q cuts as described in the text and compared to the phonon linewidth for CH3NH3PbCl3 (gray squares, from Ref. [1]). The blue and gray dashed lines are a guide to the eye. The gray dashed area represents the instrumental resolution of IN22.

