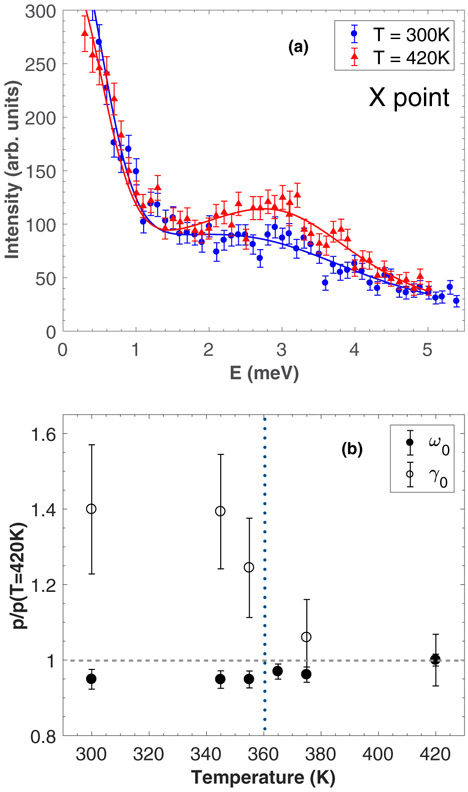
FIG. 7.
(a) Constant-Q cuts through the TA1 mode at the X point measured on IN22 at 300 K (orthorhombic phase) and 420 K (cubic phase). (b) Temperature dependence of the energy position (black circles) and the energy linewidth (white circles) of the TA1 phonon at the X zone boundary. The vertical dashed line indicates the orthorhombic transition.

