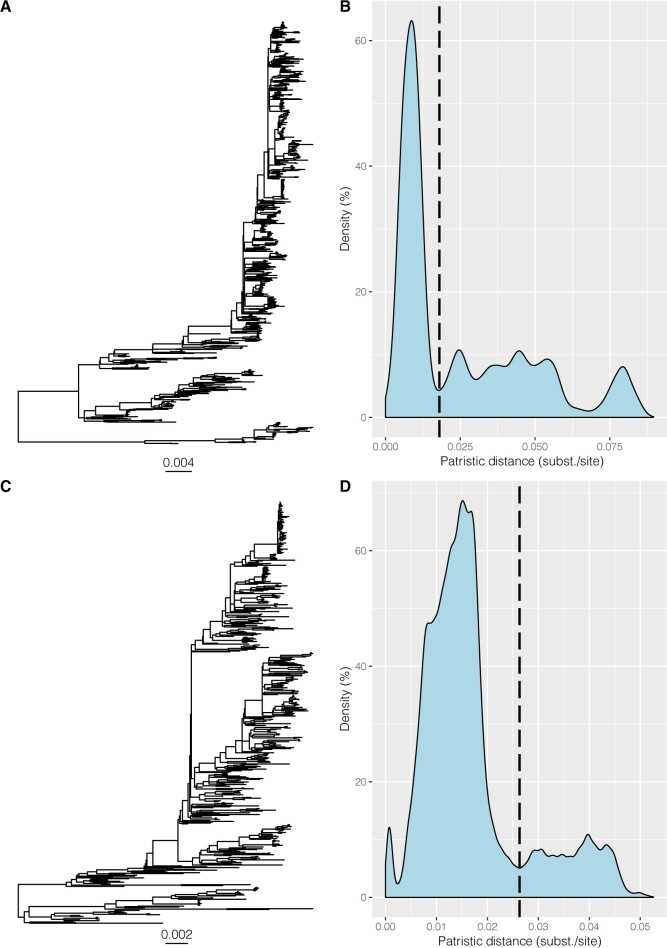
Figure 2.
Whole-genome phylogenies and density distributions of patristic distances for HRSV-A and HRSV-B. Patristic distances were calculated between all tips of the ML trees of whole-genome alignments of HRSV-A (A) and HRSV-B (C) and cut-off values were chosen at the lowest point after the major peak in the density plot, determined at 0.018 subst./site for HRSV-A (B) and slightly higher at 0.026 subst./site for HRSV-B (D).

