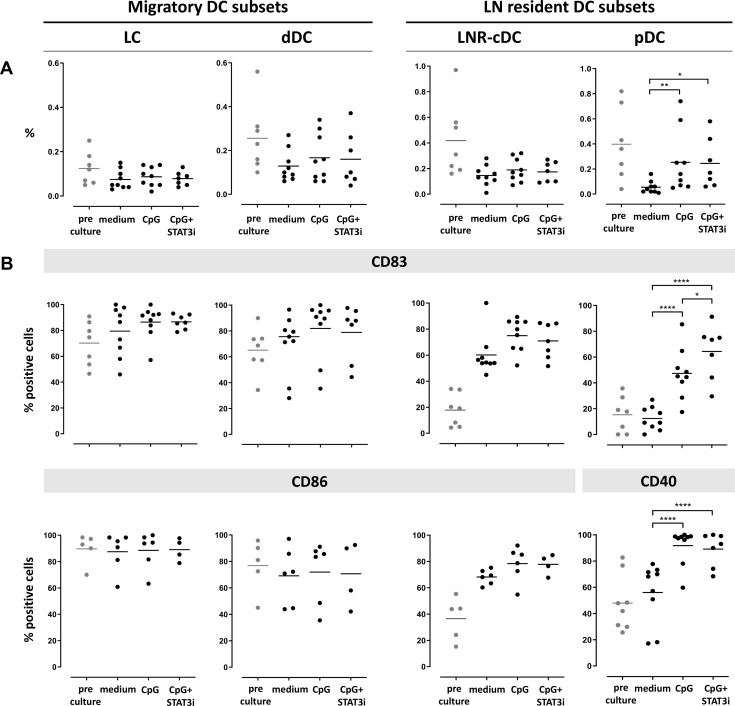
Figure 2.
Frequency and activation state of DC subsets pre/post-SLN single-cell culture (at day 2). Columns represent the different DC subsets. On the left the two CD1a+ migratory cDC subsets (LC and dDC), on the right the two LN resident DC subsets (LNR-cDC and pDC). In each dot plot, day 2 post-culture data of each culture condition (medium, CpG and CpG+STAT3i) are shown and compared. Corresponding pre-culture data are displayed in gray dots. (A) Frequencies of DC subsets, expressed as percentage of total LN cells. (B) Expression levels of maturation (CD83) and co-stimulatory/activation (CD86 for cDC and CD40 for pDC) surface receptors on different DC subsets, expressed as percentage of positive cells within each subset. Bars represent means. *p=0.01–0.05; **p=0.001–0.01; ***p=0.0001–0.001 and ****p<0.0001 in a repeated measures one-way ANOVA (or mixed-effects model in case of missing values), with post-hoc multiple comparison Tukey’s test. ANOVA, analysis of variance; cDC, conventional DC; DC, dendritic cell; dDC, dermal-like DC; LC, Langerhans cell; LN, lymph node; LNR, LN resident; pDC, plasmacytoid DC; SLN, sentinel LN; STAT3i, signal transducer and activator of transcription 3 inhibitor.

