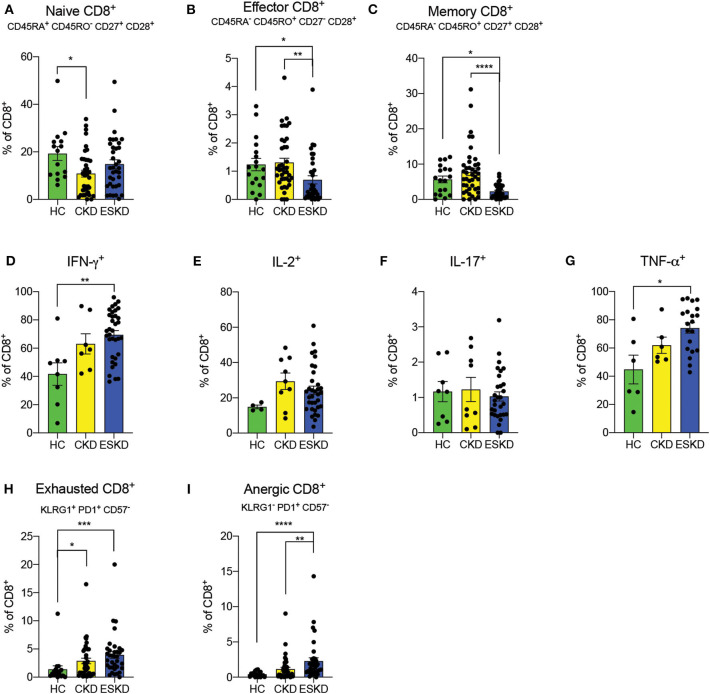
Figure 4.
CD8+ T cell subsets in the three study groups. (A–C) Naïve, effector, and memory CD8+ T cells. (D–G) IFN-γ, IL-2, IL-17, and TNF-α staining on CD8+ T cells. (H,I) Exhausted and anergic CD8+ T cells. Data are represented as mean and standard error of the mean (SEM). Each dot represents an individual value. *P < 0.05; ****P < 0.000.1. Kruskal–Wallis test. Gating strategy is shown in Supplementary Figure 3.

