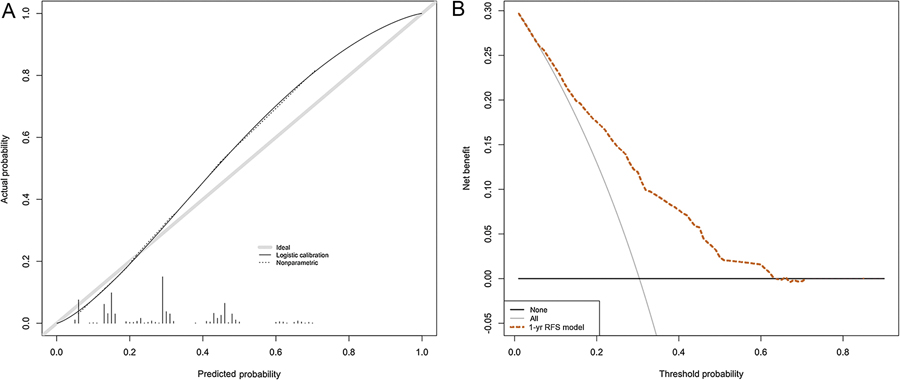
Fig. 2 –
Calibration plot and decision curve analysis for the Cox-based nomogram for prediction of 1-yr recurrence-free survival (RFS). (A) Average predicted probability (nomogram-predicted 1-yr RFS) versus Kaplan-Meier estimate (observed 1-yr RFS) with 95% confidence interval for the Kaplan-Meier estimate. The grey line indicates the reference, where an ideal nomogram would lie. (B) Net benefit of a strategy involving treating all patients (grey line), no patients (black line), or according to the nomogram predictions (dotted line). The plot shows that model-based decisions are supported for a threshold probability range of approximately 10–60% at 12 mo.

