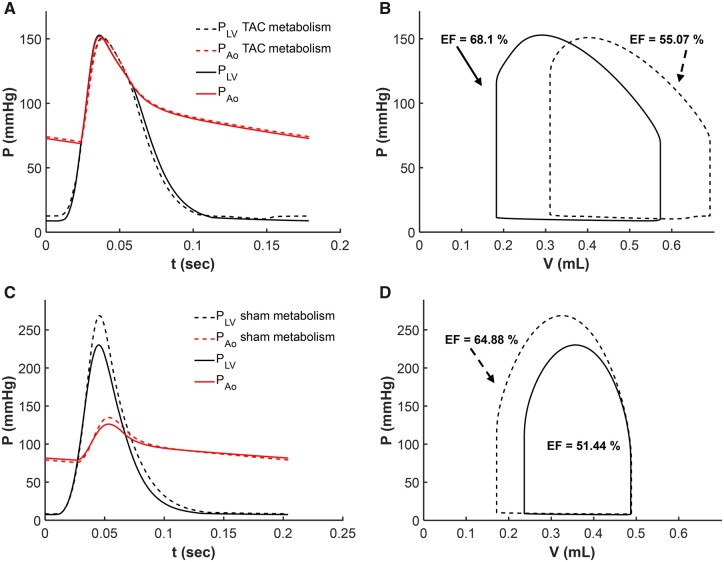
Figure 9.
Analysis of Effects of Metabolic State on Mechanical Function. Simulations of left-ventricular and aortic pressure (A and C) and left-ventricular pressure–volume loops (B and D) are shown for sham rat #3 and TAC rat #2. The baseline simulations (solid lines) are equivalent to those shown in Fig. 7. Dashed lines in (A) and (B) illustrate model predictions associated with replacing the metabolic model parameter values for sham rat #3 with values representing the mean TAC rat. Imposition of the TAC rat metabolic phenotype on the sham rat results in an increase in inorganic phosphate concentration, diminished systolic contractility, and reduction in EF. Dashed lines in (C) and (D) illustrate model predictions associated with replacing the metabolic model parameter values for TAC rat #2 with values representing the mean sham rat. Imposition of the control sham metabolic phenotype on the TAC rat results in a decrease in inorganic phosphate concentration, improved systolic contractility, and increase in EF.

