
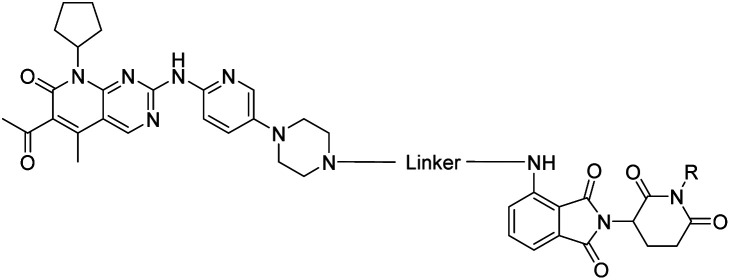
Table 1. Activities of the CRBN-addressing CDK4/6d.
| |||||||
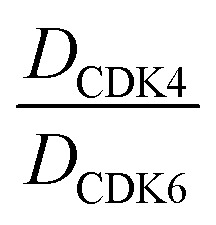
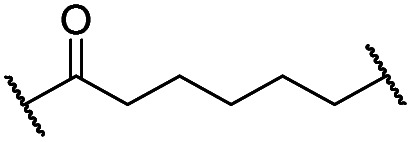
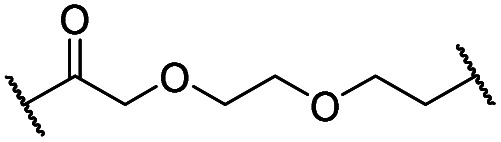
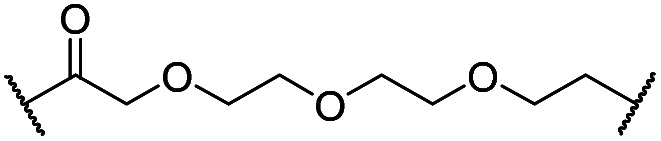
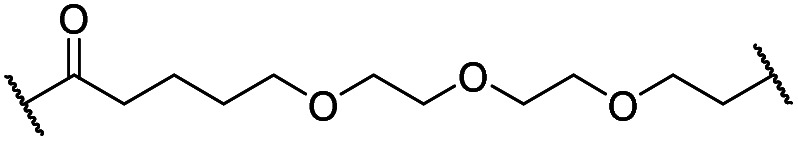
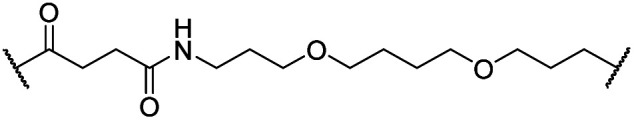
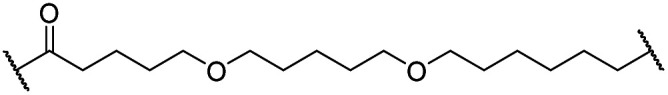
| Cmpd | Linker | R | elog D7.4 a | D CDK4 b | D CDK6 b |
 c
c
|
D IKZF1 d |
| 0.1 μM | 0.1 μM | 0.1 μM | 0.1 μM | ||||
| 3 (POM) | — | — | n.d e | 91 | 91 | n.d. | 17 |
| 8 (BSJ-03-123) | — | — | 2.5 | 27 | 5.5 | 4.9 | 82 |
| 11 |
|
H | 3.4 | 25 | 11 | 2.3 | 1.0 |
| 12 |
|
H | 2.8 | 19 | 8.4 | 2.3 | 0.8 |
| 13 |
|
H | 2.8 | 15 | 7.7 | 1.9 | 1.0 |
| 14 |
|
H | 3.1 | 26 | 7.8 | 3.3 | 0.8 |
| 15 |
|
H | 3.1 | 91 | 65 | 1.4 | 56 |
| 16 |
|
H | 4.6 | 76 | 32 | 2.4 | 6.7 |
| 17 |
|
H | 5.2 | 86 | 51 | 1.7 | 18 |
| 18 |
|
H | 4.4 | 57 | 17 | 3.4 | 5.9 |
| 19 |

|
H | 5.4 | >95 | 51 | n.d. | 35 |
| 20 |

|
H | 3.7 | 86 | 16 | 5.4 | 5.8 |
| 21 |
|
Me | 3.6 | 95 | >95 | n.d. | 93 |
aExperimental distribution coefficient at pH 7.4.
bCDK4 or CDK6 degradation indicated as remaining CDK4 or CDK6 levels after 16 h treatment of each compound at the indicated concentration. Percentage values are normalized to DMSO-treated MM.1S cells and the respective loading controls (100%). All of the data were the average of at least three independent experiments.
cSelectivity ratio for the degradation of CDK6 over CDK4.
dNeosubstrate degradation indicated as remaining IKZF1 levels, respectively.
eNot determined.