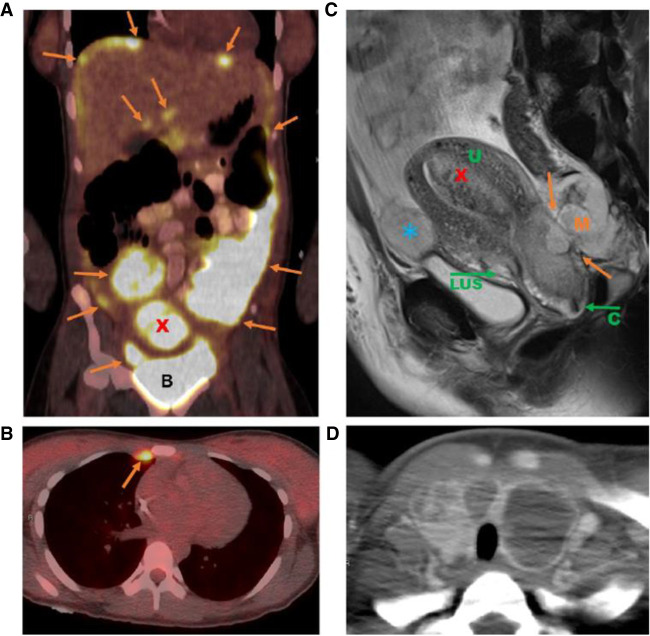
Figure 1.
Imaging findings at diagnosis. (A) Abdominal fluorodeoxyglucose (FDG)-positron emission tomography (PET) scan image demonstrating diffuse hypermetabolic omental, peritoneal, and perihepatic tumor implants (orange arrows) as well as hypermetabolic intrauterine mass (red X). (B) Bladder. (B) Chest FDG-PET scan image demonstrating hypermetabolic internal mammary chain node (orange arrow). (C) Sagittal pelvic magnetic resonance imaging (MRI) image demonstrating pelvic mass invading cervix and lower uterine segment (orange arrows), intrauterine mass (red X), and peritoneal implant anterior to uterus (blue *). (U) Uterus, (LUS) lower uterine segment, (C) cervix, (M) mass. (D) Axial CT image showing thyroid gland with multifocal cystic lesions consistent with multinodular goiter.

