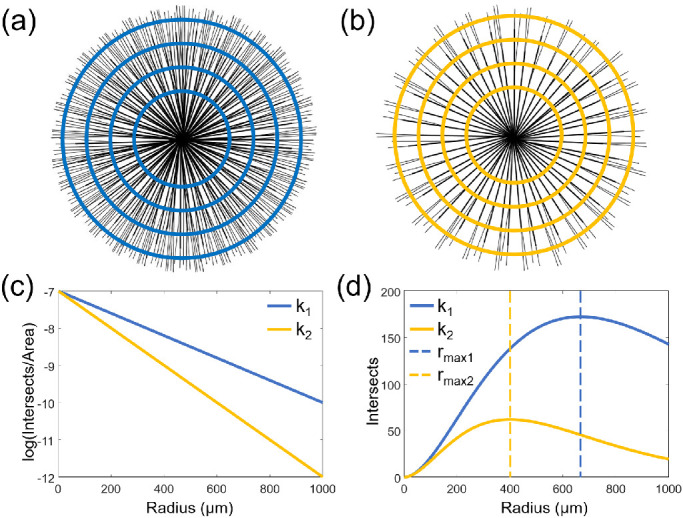
Figure 3.

RGC axon bundle organization analysis. (a) Illustration of the retina with high RGC axon bundle density. (b) Illustration of the retina with low RGC axon bundle density. (c) The semi-log relationship between RGC axon bundle intersections and radius. (d) RGC axon bundle intersections as a function of radius. k1, high density; k2, low density.
