Figure 4.

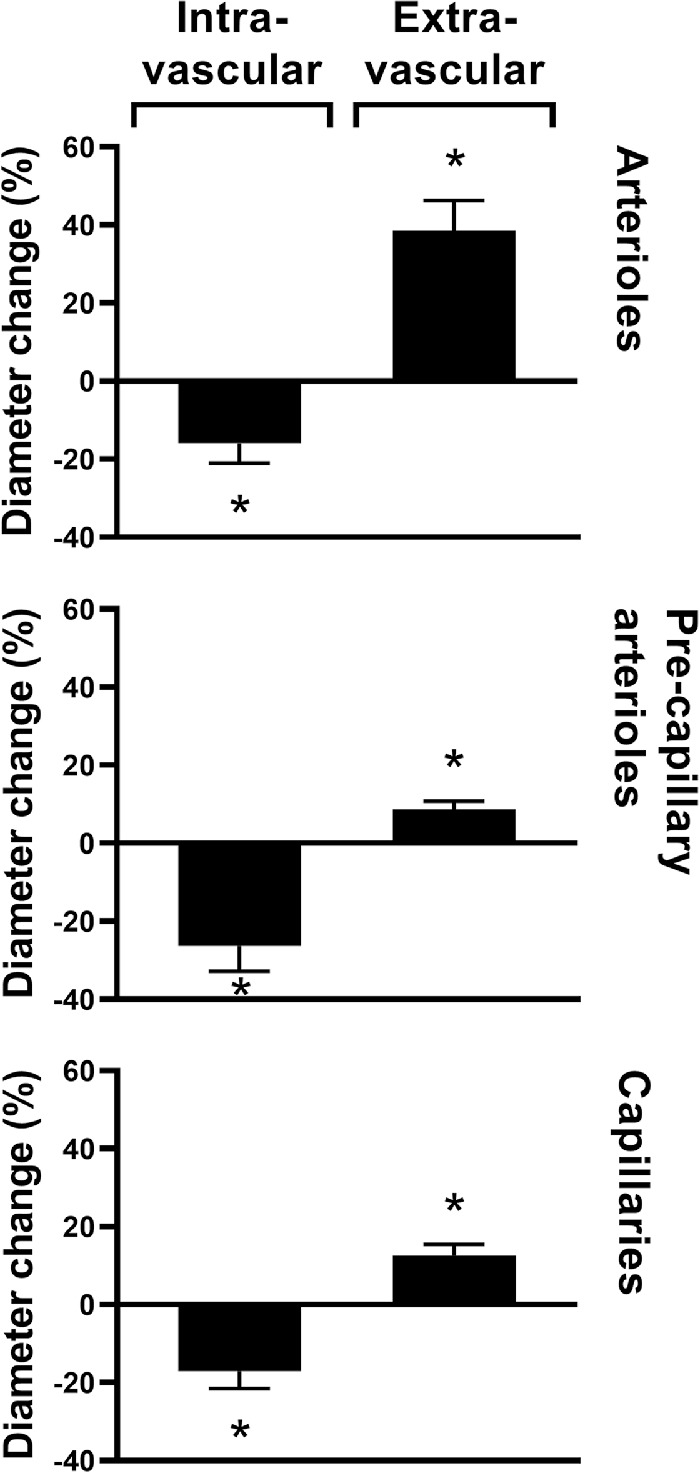
Changes in the diameters of the three studied vessel branches in percent (mean ± SEM) from preconstriction after intra- and extravascular application of ATP. Asterisks indicate P < 0.05 (n = 8 for all series).

Changes in the diameters of the three studied vessel branches in percent (mean ± SEM) from preconstriction after intra- and extravascular application of ATP. Asterisks indicate P < 0.05 (n = 8 for all series).