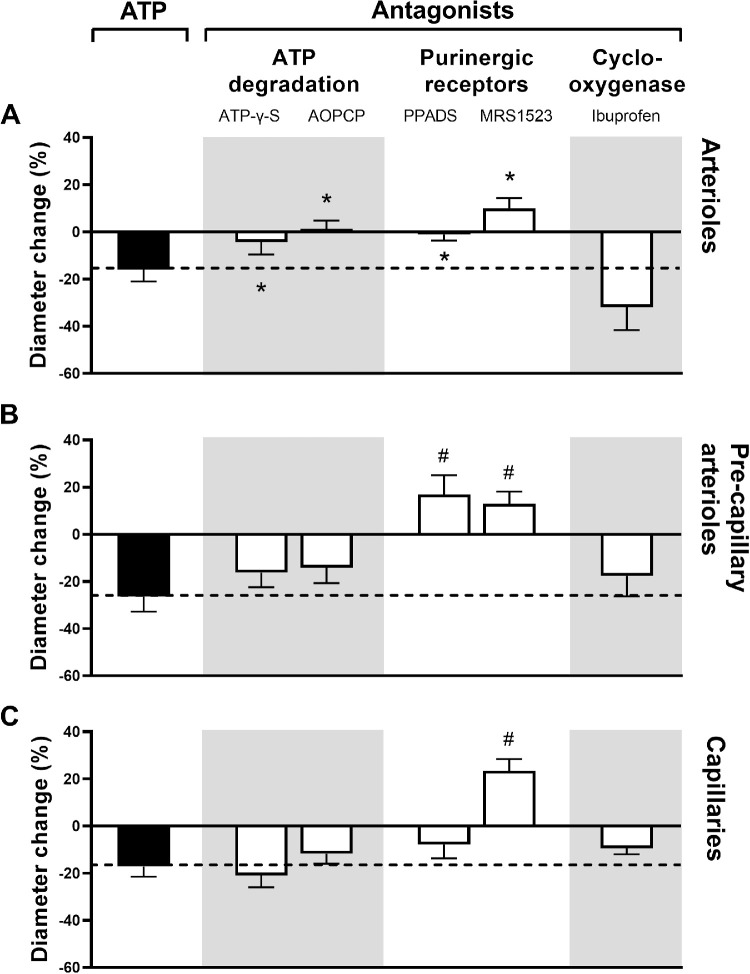
Figure 5.
The diameter change in percent (mean ± SEM) after intravascular application of ATP (solid columns), the level of which is continued with a dashed line in order to facilitate the interpretation of the effects of antagonists (white columns). Asterisks indicate P < 0.05 and pound signs P < 0.01 (n = 8 for all series).

