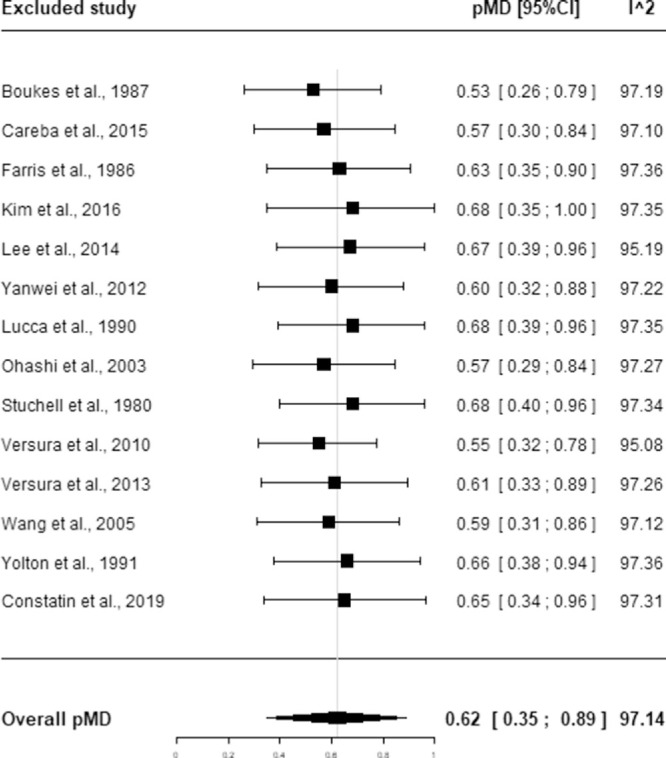
Figure 3.

Influence analysis for DE. Squares represent the pMD obtained excluding the indicated study. Horizontal lines represent 95% CIs. The diamond represents the overall pMD estimate with corresponding 95% CIs obtained in the main analysis. I^2 is the value of the I2 index.
