Figure 4.

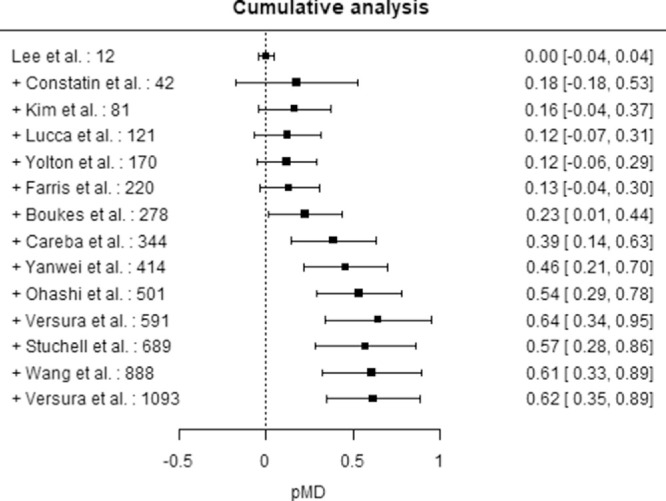
Cumulative analysis by sample size – DE. Squares represent the pMD obtained adding a study at a time ordered by increasing sample size indicated study. Horizontal lines represent 95% CIs.

Cumulative analysis by sample size – DE. Squares represent the pMD obtained adding a study at a time ordered by increasing sample size indicated study. Horizontal lines represent 95% CIs.