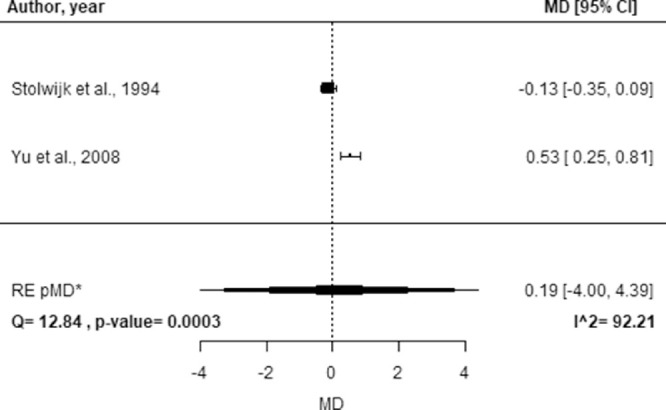
Figure 6.

Forest plot of study-specific MDs of Lf concentration between healthy controls and subjects affected by DR. Squares represent the study-specific, relative MD. The size of the squares reflects the study-specific statistical weight, that is, the inverse of the variance. Horizontal lines represent 95% CIs. The diamond represents the pMD estimate with corresponding 95% CIs. Q and P value are the statistic tests used to assess heterogeneity and the corresponding p-value; I^2 is the value of the I2 index. *CIs calculated using the Hartung Knapp Sidik Jonkman method.
