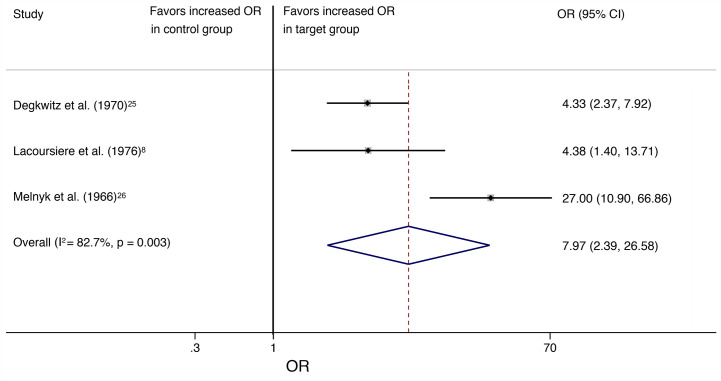
Figure 3.
The square data markers indicate the proportion of individuals with withdrawal symptoms in each study, with sizes reflecting the statistical weight of the study using random-effects meta-analysis. The horizontal lines indicate 95% CIs. The blue diamond data marker represents the overall proportion and 95% CI. The vertical dashed line shows the overall effect estimate, and the continuous line represents the line of no effect (OR = 1).

