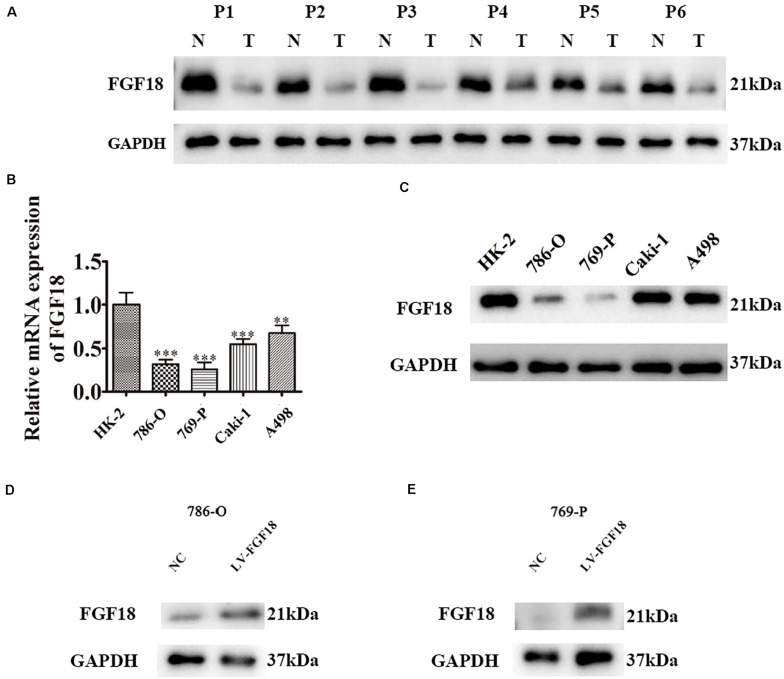
FIGURE 3.
Low expression of FGF18 in ccRCC clinical samples and cell lines. (A) The expression of FGF18 in six paired ccRCC normal and tumor tissues were analyzed with western blot. N, normal tissues; T, tumor tissues. (B) FGF18 expression in 786-O, 769-P, Caki-1, A498, and the normal renal epithelial cells HK-2 with RT-PCR. Data of three experiments are presented as the mean ± SD. ∗∗P < 0.01, ∗∗∗P < 0.001 versus the normal group. (C) FGF18 expression in 786-O, 769-P, Caki-1, A498, and the normal renal epithelial cells HK-2 with western blot. (D) Overexpression of FGF18 in 786-O using lentivirus. (E) Overexpression of FGF18 in 769-P using lentivirus.

