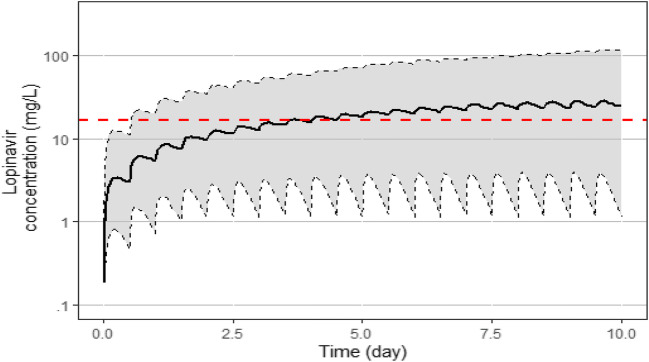
Fig. 3.
Concentration versus time of lopinavir simulations over 10 days following 400 mg bid in covid-19 patients. Under the figure: The continuous line represents the median lopinavir concentration and the shaded area the 90% prediction interval determined by 500 simulations (5th/95th). The horizontal dashed line is the estimated minimal effective concentration (MEC) of lopinavir (16.7 mg/L) against SARS-CoV-2 virus in Vero E6 cells [2]

