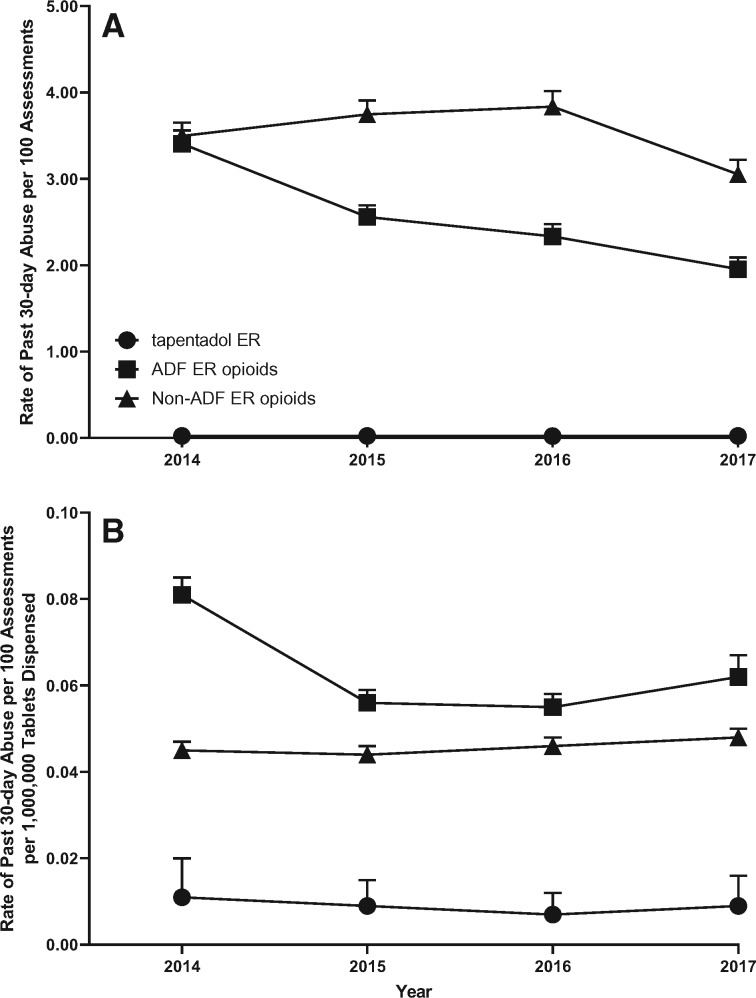
Figure 1.
Annual rate of past 30-day abuse (A) and annual rate of past 30-day abuse adjusted for tablets dispensed (B). Data are displayed by calendar year. Tapentadol extended-release (ER) is represented by a circle, the abuse-deterrent formulation (ADF) ER opioid comparator group is represented by a square, and the non-ADF ER opioid comparator group is represented by the triangle. Error bars represent the 95% confidence interval.

