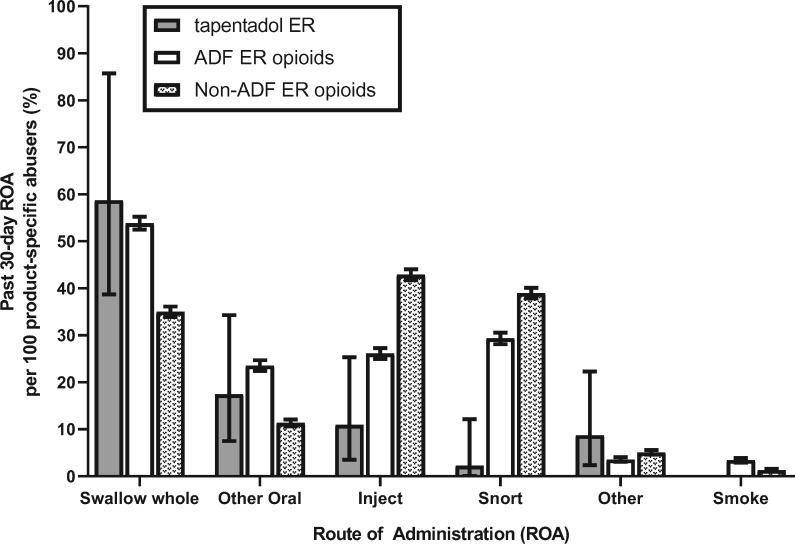
Figure 2.
Cumulative percentage of product-specific abusers reporting past 30-day route of administration per 100 product-specific abusers for tapentadol extended-release (ER), abuse-deterrent formulation (ADF) ER opioids, and non-ADF ER opioids. Data are displayed cumulatively (each bar represents an average across years 2014–2017). Tapentadol ER is represented by the black bar, the ADF ER opioid comparator group is represented by a white bar, and the non-ADF ER opioid comparator group is represented by the patterned bar. Error bars represent the 95% confidence interval.

