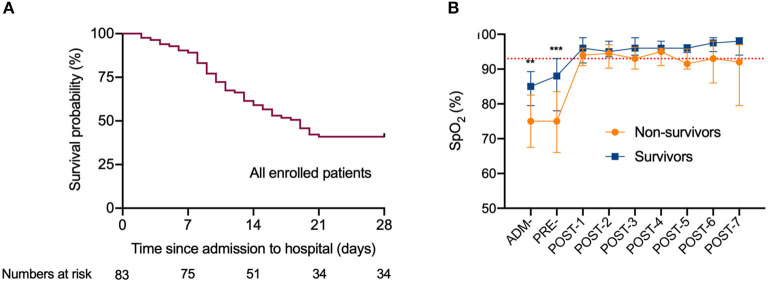
Figure 1.
The survival curve of critically ill patients with COVID-19 undergoing invasive mechanical ventilation, and dynamic changes of the oxygen saturation during hospitalization. (A) The survival curve of all enrolled patients with COVID-19 undergoing invasive mechanical ventilation. (B) Dynamic changes of the oxygen saturation during hospitalization. The dotted lines in red show the SpO2 at 93%.Data are median (IQR). *Indicate difference between the survivors and non-survivors by t-tests or Mann-Whitney U-test. Significant differences are expressed as follows: * < 0.05, ** < 0.01, *** < 0.001. SpO2, oxygen saturation; ADM-, admission to hospital; PRE-, pre-intubation; POST-1 to POST-7, post-intubation day 1 to post-intubation day 7.

