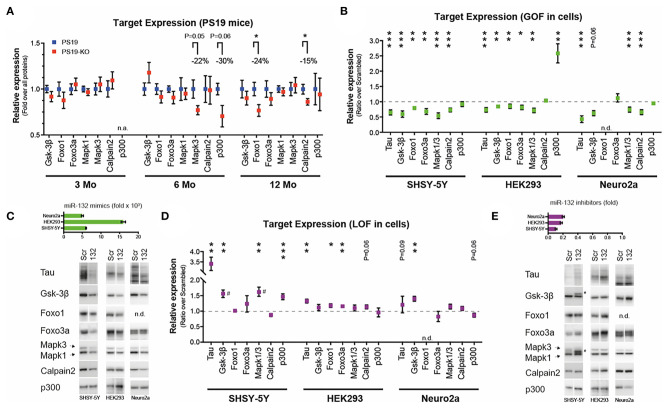
Figure 2.
Analysis of miR-132 targets in vitro and in vivo. (A) Western blot quantifications of endogenous miR-132 targets (Gsk-3β, Foxo1, Foxo3a, Mapk1/Erk2, Mapk3/Erk1, Calpain2, p300) in PS19 and PS19-KO mice at different ages in the cortex. All significant trends and changes indicate lower expression in KO mice. N = 6–15 per group, mixed sex. Unpaired t-test, where *P < 0.05. (B) Western blot quantification of endogenous miR-132 targets, including tau, in native human SHSY-5Y, human HEK293, and murine Neuro2a cells. Cells were treated with 50 nM miR-132 mimics or scrambled control for 48 h prior to protein extraction. N = 2–4 experiments performed in triplicate. Results are shown as ratios between miR-132 over scrambled mimics (normalized to 1). Unpaired t-test, where *P < 0.05, **P < 0.01, ***P < 0.001. (C) Upper panel: Ectopic miR-132 levels measured by qRT-PCR in each cell line. Relative to scrambled mimic control. Lower panel. Representative western blot analyses. (D) Western blot quantifications of endogenous miR-132 targets. Here, cells were treated with 50 nM miR-132 inhibitors or scrambled control for 48 h. Unpaired t-test, where *P < 0.05, **P < 0.01, ***P < 0.001. (E) Upper panel: Endogenous miR-132 levels measured by qRT-PCR in each cell line following treatment. Relative to scrambled inhibitor control (normalized to 1). Lower panel. Representative western blot analyses. miRNA qRT-PCR were normalized using RNU19 as before (61, 64). Blots were normalized to all proteins using Ponceau or Stain-Free technology. # denotes possible alternate splicing (65) or phosphorylated form of targets. N.A., not available; N.D., not detected; GOF, gain-of-function; LOF, loss-of-function. Error bars represent SEM. In A, the groups of mice were analyzed separately per age. See Supplementary Methods for additional details.

