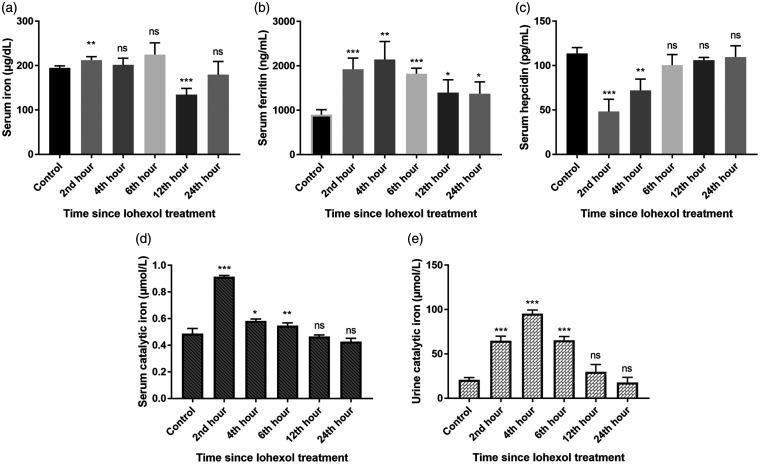
Figure 7.
Demonstrating (a) Serum iron, (b) Serum ferritin, (c) Serum hepcidin, (d) Serum catalytic iron, and (e) Urine catalytic iron levels in Control and iohexol-treated rats, respectively. The values represent mean ± SD (n = 6 rats per group). *P < 0.05, ** P < 0.01, ***P < 0.001 versus control.

