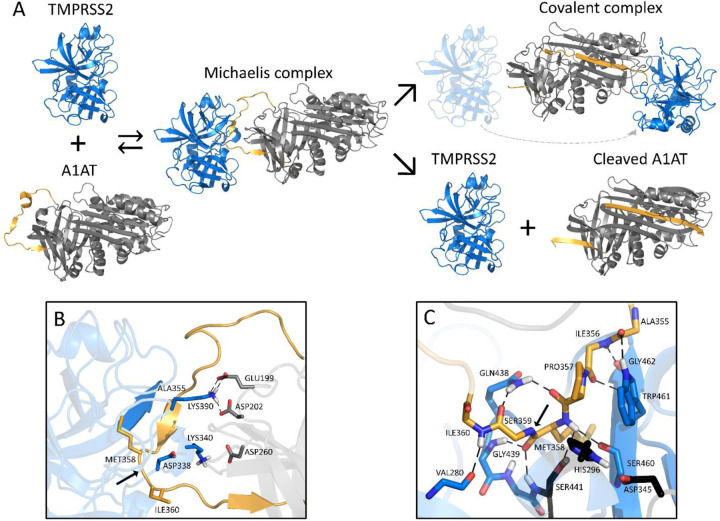
Figure 3. Schematic inhibition of TMPRSS2 by A1AT.
A. General inhibitory mechanism of serpins applied to TMPRSS2 and A1AT are shown. The homology model of TMPRSS2 is shown as the blue cartoon and A1AT as the grey cartoon, with the reactive center loop highlighted in gold. B. Shown are the interactions at the interface of the Michaelis complex model, highlighting LYS340 and LYS390 of TMPRSS2 (blue) and GLU199, ASP202, and ASP260 of A1AT (grey). C. A close-up of the Michaelis complex at the active site region is shown. The catalytic triad residues HIS296, ASP345 and SER441 are depicted in black. Relevant residues are represented as sticks, hydrogen bonds are represented as dashed black lines, and the cleavage site is indicated by a black arrow. Note that there are hydrogen bonds at the oxyanion hole between GLY439/SER441 of TMPRSS2 and MET358 of A1AT. A1AT, alpha 1 antitrypsin; TMPRSS2, transmembrane serine protease 2.

