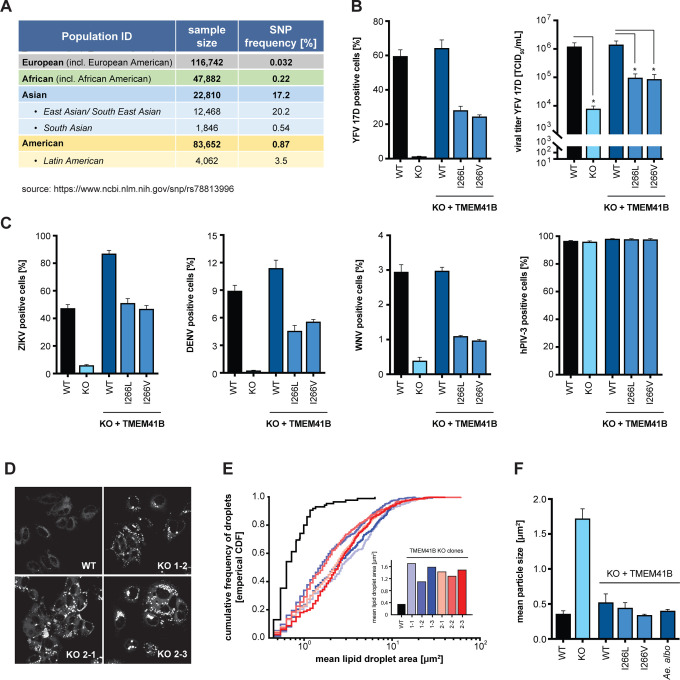
Figure 4. Naturally occurring TMEM41B SNPs negatively impact flavivirus infection but are able to maintain normal lipid distribution in cells.
(A) Table shows the frequency of a SNP (rs78813996) in TMEM41B in several human populations. (B) WT, TMEM41B KO, and TMEM41B KO HAP1 cells expressing WT or TMEM41B SNP variants infected with YFV 17D, MOI = 0.005 PFU/cell for 48 h. Left, cells were analyzed by flow cytometry and plotted as a percentage of viral antigen positive cells. Right, supernatants were collected and titrated by tissue culture infectious dose (TCID50/ml) assay on Huh-7.5 cells. (C) Same as panel (B, left) with ZIKV at MOI = 0.25 PFU/cell for 48 h; DENV-GFP at MOI = 0.1 PFU/cell for 96 h; WNV-GFP at MOI = 1 PFU/cell for 72 h; and hPIV-3-GFP at MOI = 0.02 IU/cell for 48 h. (D) WT and TMEM41B KO Huh-7.5 cell clones stained with Nile red to visualize lipid droplets. (E) Cumulative frequency of droplets plotted vs. droplet area (μm2) for six independent single cell clones generated with two independent sgRNAs. Inset shows the mean lipid droplet area (μm2) for the six TMEM41B KO clones compared to WT Huh-7.5 cells. (F) Mean lipid droplet area (μm2) for WT, TMEM41B KO, and TMEM41B KO Huh-7.5 cells (clone 1–1) expressing the indicated TMEM41B variants. Cells were analyzed by flow cytometry and plotted as a percentage of viral antigen positive cells. Error bars depict SD for three replicates.

