. 2020 Oct 1;17:E116. doi: 10.5888/pcd17.190445

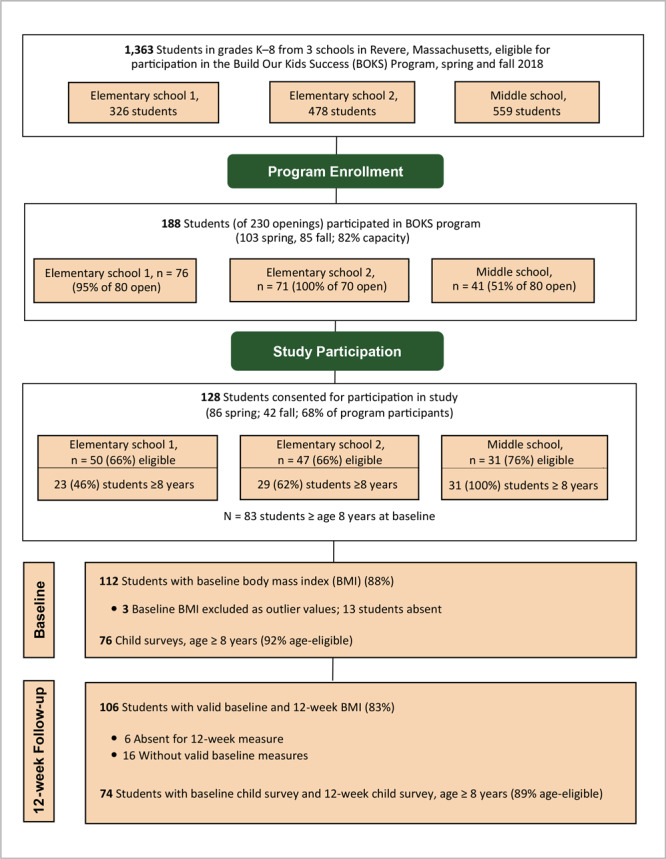
Figure 2.

The diagram illustrates program reach and participation in the Build Our Kids Success program evaluation during spring and fall sessions, 2018. At maximum capacity, the program could accommodate 230 students over 2 sessions, or approximately 17% of the total student body across the 3 schools. A total of 188 students (82%) of potentially 230 students began the program. More students, 116 of 128, contributed measurements at follow-up than those at baseline, 112 of 128. Total enrollment for fall session was reduced to 110 students, because elementary school 2 decreased target enrollment from 40 to 30 students for a lower student-to-trainer ratio.

Flow diagram of physical activity participants in the Build our Kids Success (BOKS) evaluation from 3 schools in Revere, Massachusetts, spring and fall 2018.