Figure.
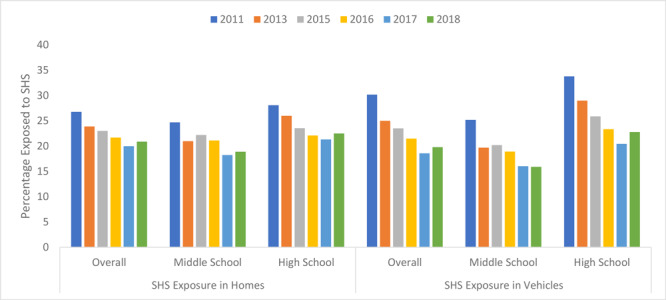
Prevalence of self-reported exposure to secondhand smoke (SHS) in homes and vehicles during the past 7 days among US middle and high school students, overall and by school level, National Youth Tobacco Survey, 2011–2018.
| Year | SHS Exposure in Homes |
SHS Exposure in Vehicles |
||||
|---|---|---|---|---|---|---|
| Overall | Middle School | High School | Overall | Middle School | High School | |
| 2011 | 26.8 | 24.7 | 28.1 | 30.2 | 25.2 | 33.8 |
| 2013 | 23.9 | 21.0 | 26.0 | 25.0 | 19.7 | 29.0 |
| 2015 | 23.0 | 22.2 | 23.6 | 23.5 | 20.2 | 25.9 |
| 2016 | 21.7 | 21.1 | 22.1 | 21.5 | 18.9 | 23.4 |
| 2017 | 20.0 | 18.2 | 21.3 | 18.6 | 16.0 | 20.5 |
| 2018 | 20.9 | 18.9 | 22.5 | 19.8 | 15.9 | 22.8 |

