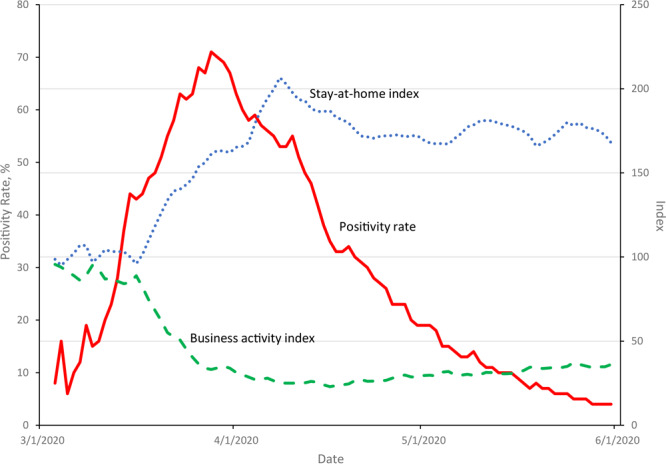
Figure.

Citywide trends in the positivity rate for severe acute respiratory syndrome coronavirus 2 (SARS-CoV-2) and business activity and stay-at-home indices, New York City, March 3–May 31, 2020. The positivity rate gives the percentage of daily tests that had a positive result; the business activity index gives the number of visitors to points of interest (such places as stores, restaurants, parks, hospitals, or museums) in a zip code; and the stay-at-home index counts the number of smartphone devices that did not leave their home location. Both indices are averaged across zip codes (weighted by population), are lagged 3 to 7 days before the day of the test, and are normalized to equal 100 in the prepandemic period of February 4 through 6.
