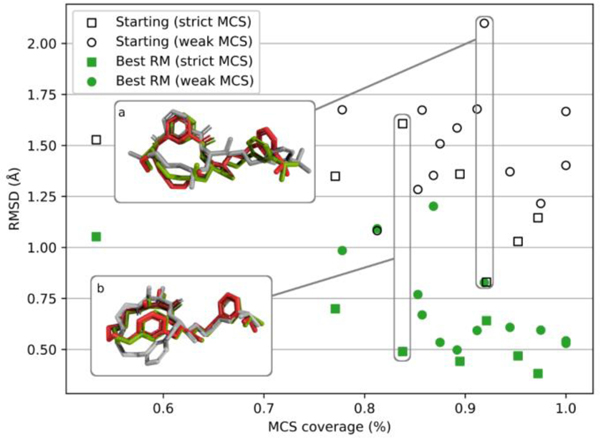
Fig. 5.
The dependency between the lowest obtained RMSD and the corresponding MCS coverage. For each of the 20 target ligands, two points are shown: a filled one for the best (lowest RMSD) RM-refined pose, and an empty one for the corresponding starting pose. The shape of a point indicates used MCS “flavor”: square for “strict” and circle for “weak.” Inset (a) shows an example of RM refinement for BACE_6, while inset (b) shows RM refinement for BACE_11. In both cases, the native structure is shown in red, the starting structure in gray, and the RM-refined structure in green

