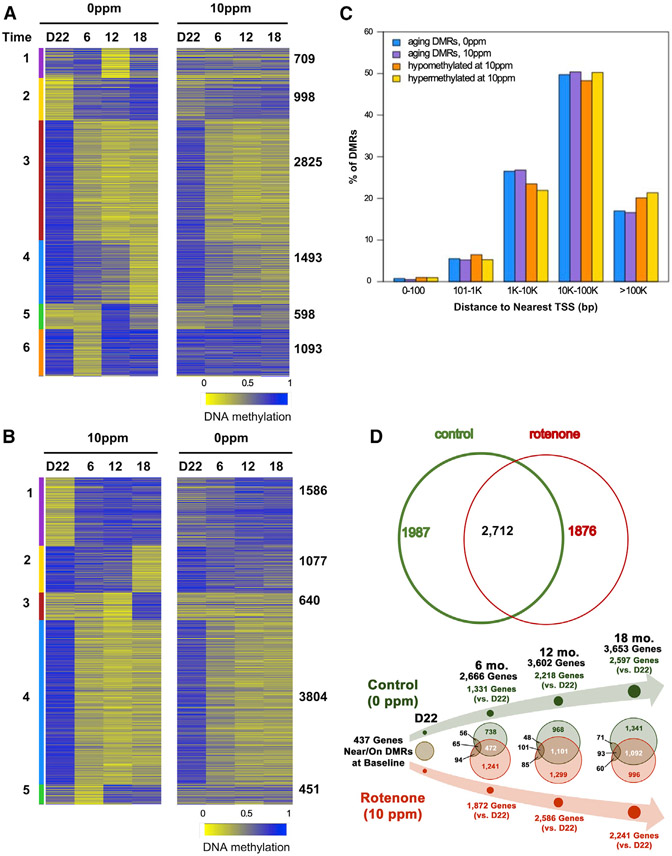
Figure 2. Perinatal Rotenone Exposure Modulates Changes in the Aging Liver DNA Methylome.
Heatmap displays DMRs: blue, hypermethylated; yellow, hypomethylated. Colored bars depict clusters (numbered 1–6); amount of DMRs that follow the cluster pattern is shown on the right. Time in months; D22 = post-natal day 22.
(A) DMRs on control animals (left panel); same loci in treated counterparts (right panel).
(B) DMRs found in the rotenone cohort (left panel); same loci in controls (right panel).
(C) Distance of DMRs to transcriptional start sites (TSSs) was calculated using Gencode VM18.
(D) Upper Venn diagram depicts overlap between all liver DMRs in control or rotenone-exposed offspring; lower Venn diagram shows DMR overlap at each time point relative to D22 within each group. In black, number of DMR-associated genes identified at baseline that were continuously differentially methylated over time.

