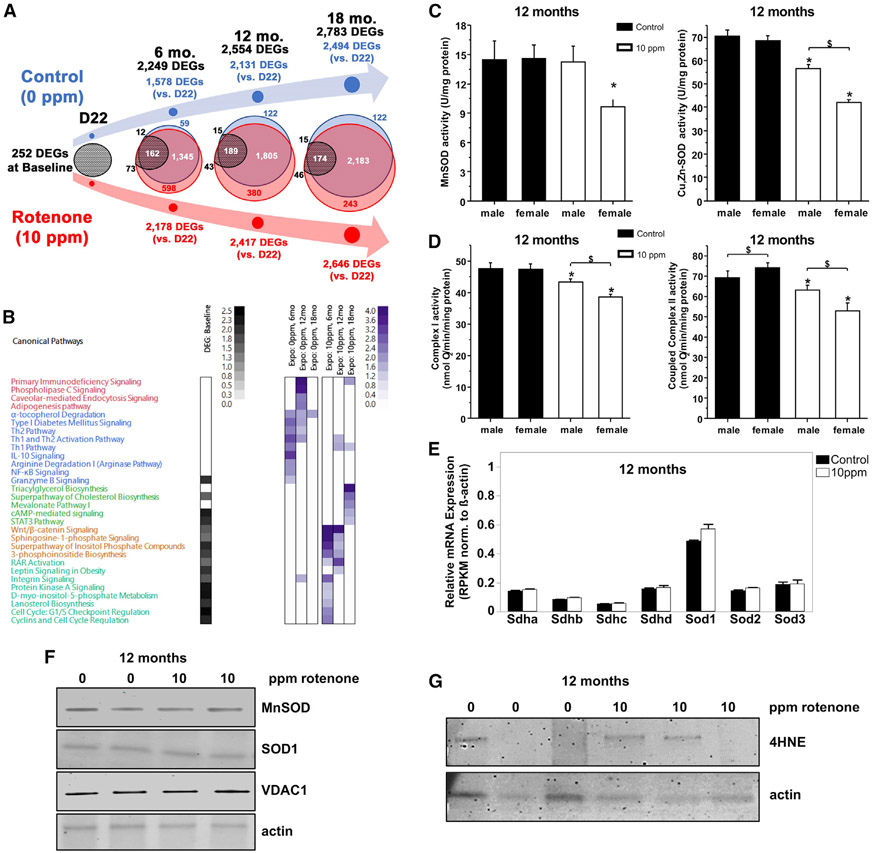
Figure 3. Perinatal Rotenone Exposure Leads to Life-Long Changes in the Liver Transcriptome.
(A) Venn diagram depicts the overlap of DEGs at each time point; baseline DEGs stem from comparisons between at D22.
(B) Heatmap of DEG-enriched biological pathways.
(C) SOD activities were measured in livers from control- or 10-ppm rotenone-exposed offspring; n = 4; data are means ± SD.
(D) Oxygen consumption through complex I (malate + glutamate) or II (succinate + rotenone) was determined in isolated mitochondria; n = 4; data are means ± SD.
(E) RNA-seq counts for actin, succinate dehydrogenase, and the SOD genes; data were normalized to actin.
(F) Representative immunoblot in whole liver homogenates.
(G) Animals were probed for the lipid peroxidation product 4HNE.

