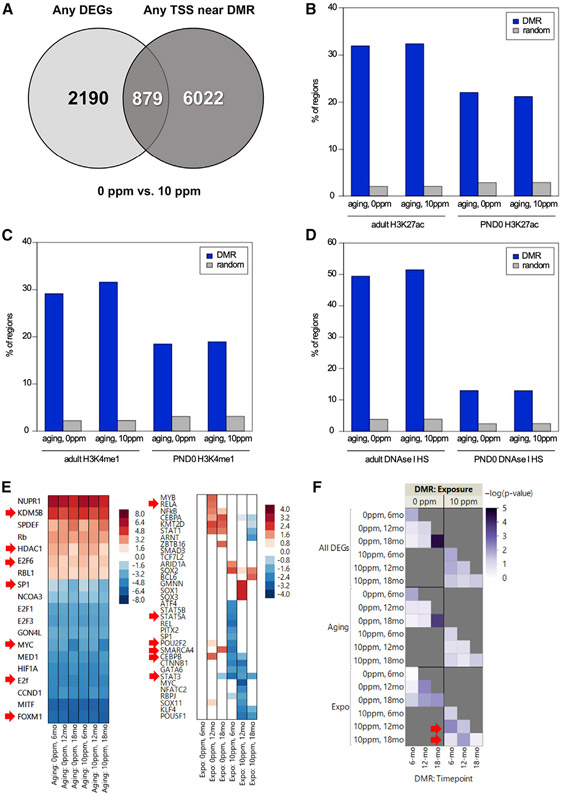
Figure 4. Differentially Methylated Regions Overlap with DEGs and Regulatory Genomic Regions.
(A) Venn diagram depicts the overlap between DMRs and the DEGs based on the closest TSS.
(B-D) Overlap of DMRs with regions enriched for H3K27ac- (B), H3K4me1- (C), or DNase-hypersensitive (D) sites using ENCODE data.
(E) IPA-predicted upstream regulators of common (left) or unique (right) DEGs to the control or rotenone-fed offspring. Red arrows depict TFs also identified using HACER.
(F) Heatmap of significance scores for enriched representation of DEGs with DMRs. Arrows indicate left-shift on timing of DNA methylation relative to transcriptional changes.

