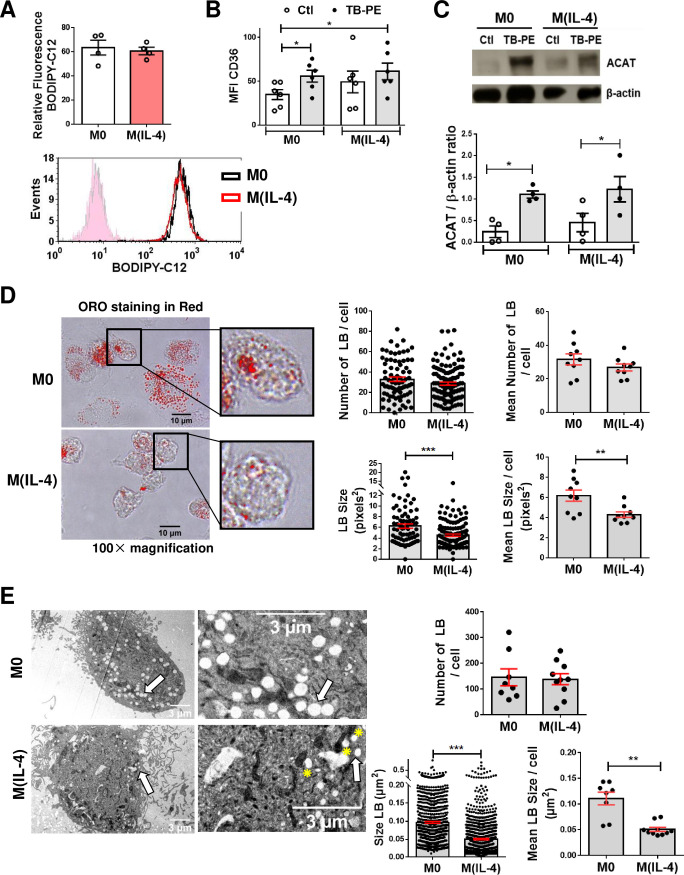
Fig 2. The biogenesis of LBs is not impaired in TB-PE-treated M(IL-4) macrophages.
(A) Human macrophages were left untreated (M0) or polarized with IL-4 (M(IL-4)) for 48 h and then exposed or not to the red-labelled saturated fatty acid C12 (BODIPY C12) for 1 min. Upper panel: relative BODIPY C12 fluorescence, lower panel: representative histogram. Values are expressed as means ± SEM of four independent experiments. (B) Median fluorescence intensity (MFI) of CD36 measured by flow cytometry in M0 and M(IL-4) macrophages exposed or not to TB-PE. Values are expressed as means ± SEM of six independent experiments. Friedman test followed by Dunn’s Multiple Comparison Test: *p<0.05 for experimental condition vs Ctl. (C) Upper panel: analysis of ACAT and β-actin protein level by Western Blot; lower panel: quantification in M0 and M(IL-4) macrophages treated or not with TB-PE for 24 h (n = 4). Wilcoxon signed rank test: *p<0.05 as depicted by lines. (D) Morphometric analysis of LBs in ORO-labelled TB-PE-treated M0 and M(IL-4) macrophages. Representative images of ORO staining (100× magnification) are shown. Number of LBs (upper left panel) and size (lower left panel) per cell are shown, and their mean is represented by red bars. Mann Whitney test: ***p<0.001. Mean number of LBs (upper right panel) and mean size (lower right panel) per cell per donor (n = 9 donors). Each determination represents the mean of 20–40 individual cells per donor. Wilcoxon signed rank test: **p<0.01. (E) Electron microscopy micrographs of TB-PE-treated M0 and M(IL-4) macrophages showing LBs (white arrows) and LBs nearby mitochondria (yellow asterisks). Upper panel: numbers of LBs per cell; Lower panels: size of LBs in TB-PE-treated M0 and M(IL-4) macrophages considering all LBs`size determinations (left) or the mean of 8–10 individual cells of one representative donor (right). Mann Whitney test: **p<0.01; ***p<0.001.

