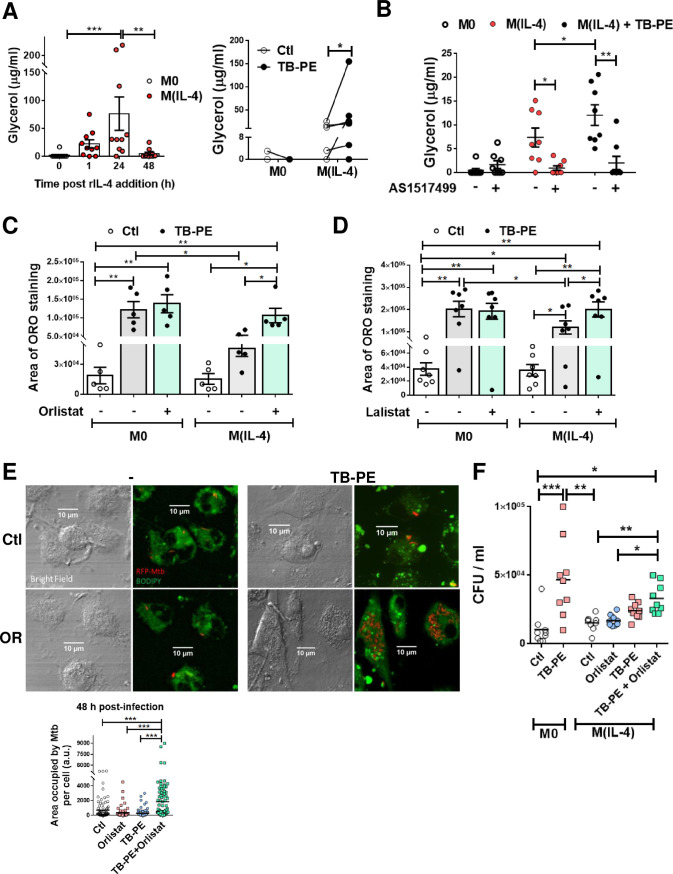
Fig 3. Enhanced lipolysis inhibits lipid bodies`accumulation in M(IL-4) macrophages.
(A) Macrophages were polarized or not with IL-4 for 1, 24 or 48 h (left panel), and then treated or not with TB-PE for further 24 h (right panel). Thereafter, culture-medium was replaced by PBS containing 2% BSA (fatty acid-free), and supernatants were collected 6h later to measure the release of glycerol during this specific frame of time by colorimetric assays. Left panel: glycerol release during 6 h after 1, 24 or 48 h- cultures post-IL-4 addition (n = 10). Right panel: glycerol release after TB-PE treatment in M0 or M(IL-4) macrophages (n = 6). (B) Glycerol release by macrophages exposed or not to AS1517499 (n = 8). Values are expressed as means ± SEM of independent experiments. (C-D) ORO staining of M0 and M(IL-4) macrophages treated with TB-PE and exposed or not to either Orlistat (C) or Lalistat (D). Values are expressed as means ± SEM of five (C) or seven (D) independent experiments, considering five microphotographs per experiment. (E-F) M(IL-4) macrophages were treated or not with TB-PE in the presence or not of Orlistat for 24 h, washed and infected with RFP-Mtb (MOI of 5 bacteria/cell) (E) or unlabeled Mtb (MOI of 0.2 bacteria/cell) (F). (E) Area with RFP-Mtb per cell in z-stacks from confocal laser scanning microscopy images at 48 h post-infection. Representative images are shown (60× magnification). Each determination represents individual cells of one donor. One way-ANOVA followed by Bonferroni test: ***p<0.001. (F) Intracellular colony forming units determined at 48 h post-infection (n = 9). Friedman followed by Dunn’s Multiple Comparison Test: *p<0.05; **p<0.01; ***p<0.001 as depicted by lines as depicted by lines.

