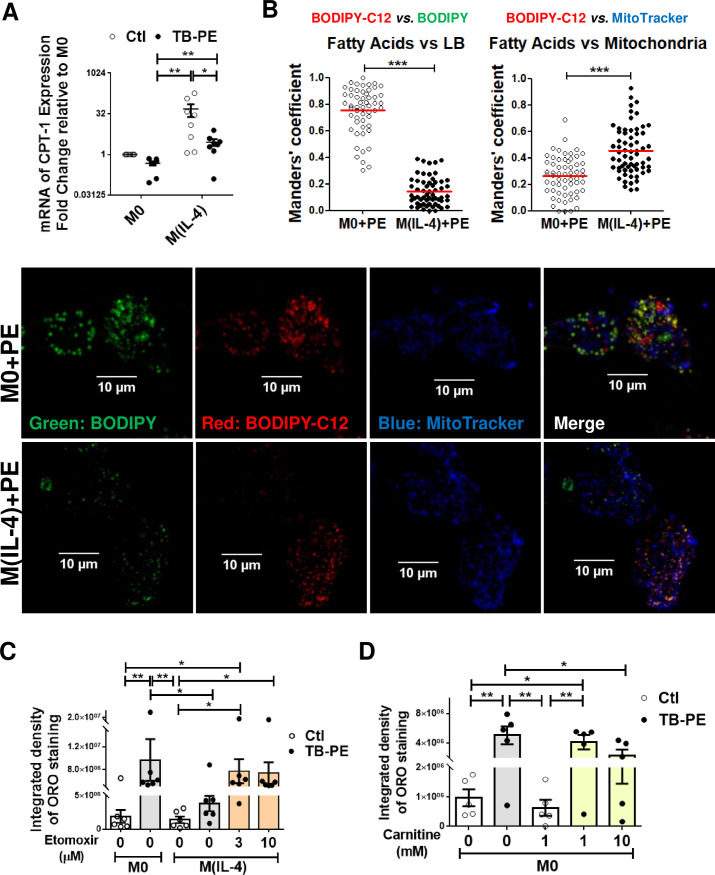
Fig 4. Inhibition of fatty acid transport into mitochondria allows lipids accumulation within LBs in TB-PE-treated M(IL-4) macrophages.
M0 and M(IL-4) macrophages treated or not with TB-PE for 24 h (A) mRNA expression of CPT1A relative to M0 (n = 8). (B) Cells were pulsed with BODIPY Red C12 overnight during TB-PE treatment, then LBs were labeled using Green-BODIPY 493/503, and mitochondria were labeled using Far Red-MitoTracker. Quantification of the co-occurrence fractions of fatty acids (C12) with either LBs or Mitochondria in TB-PE-treated M0 and M(IL-4) macrophages were quantified by Manders' coefficient analysis. Mann Whitney test: ***p<0.001. Representative images of single and merged channels are shown. (C) ORO staining of M0 and M(IL-4) macrophages treated with TB-PE and exposed or not to Etomoxir. Values are expressed as means ± SEM of six independent experiments, considering five microphotographs per experiment. (D) ORO staining of M0 macrophages treated with TB-PE and exposed or not to L-carnitine. Values are expressed as means ± SEM of five independent experiments, considering five microphotographs per experiment. Friedman test followed by Dunn’s Multiple Comparison Test: *p<0.05; **p<0.01 for experimental condition vs Ctl or as depicted by lines.

