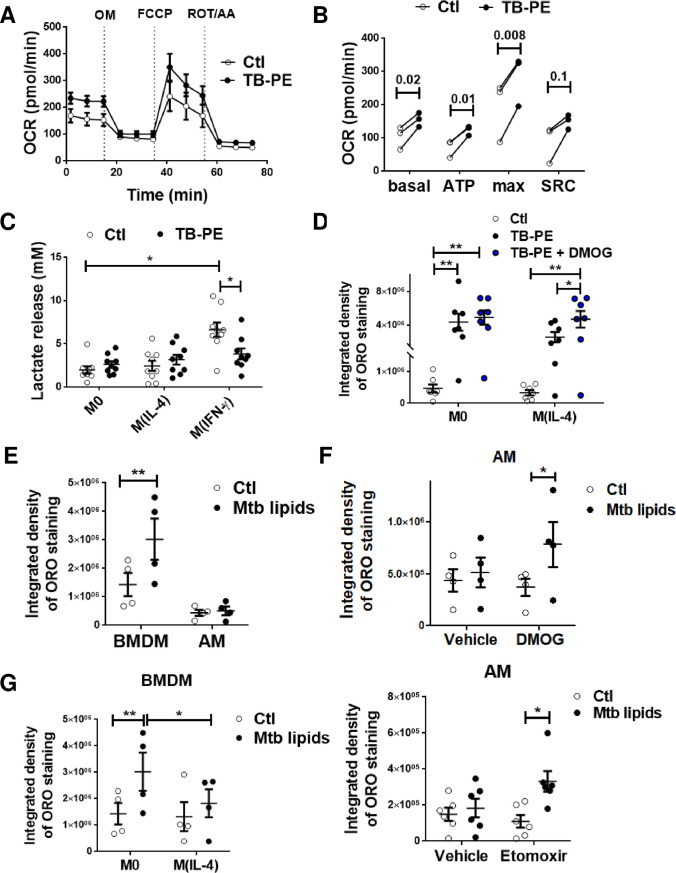
Fig 5. An oxidative metabolism is associated with less accumulation of LBs.
(A-B) Mitochondrial respiration in M(IL-4) cells exposed or not to TB-PE for 24 h. (A) Changes in oxygen consumption rate (OCR) in response to sequential injections of oligomycin (OM), carbonyl cyanide 4-(trifluoromethoxy)phenylhydrazone (FCCP), and rotenone (ROT) + antimycin A (AA) were measured by using an extracellular flux analyzer. Result showed was one representative from three independent experiments. (B) Calculated basal respiration, ATP production, maximal respiration and spare respiratory capacity are plotted in bar graphs. Values are expressed as means of triplicates and three independent experiments are shown. Paired t-tests were applied. (C) Lactate release by M0, M(IL-4) and M(IFN-γ) cells treated or not with TB-PE. M(IFN-γ) cells serves as positive control. Values are expressed as means ± SEM of nine independent experiments. Friedman test followed by Dunn’s Multiple Comparison Test: ***p<0.001 for M(IFN-γ) vs Ctl. (D) Integrated density of ORO staining of M0 and M(IL-4) macrophages treated with TB-PE in the presence or not of DMOG. Values are expressed as means ± SEM of 6 independent experiments, considering five microphotographs per experiment. Friedman test followed by Dunn’s Multiple Comparison Test: *p<0.05; for experimental condition vs Ctl or as depicted by lines. (E) Integrated density of ORO staining of murine bone marrow derived macrophages (BMDM) and alveolar macrophages (AM) treated with a total lipids’ preparation from Mtb (Mtb lipids). (F) Integrated density of ORO staining of murine AM treated or not with Mtb lipids in the presence of DMOG (upper panel, n = 4) or Etomoxir (lower panel, n = 6). Values are expressed as means ± SEM of seven independent experiments, considering five microphotographs per experiment. (G) Murine bone marrow derived macrophages (BMDM) were left untreated (M0) or polarized with IL-4 (M(IL-4)) for 48 h, treated with Mtb lipids for further 24 h, and ORO-stained for quantification of LBs accumulation. Values are expressed as means ± SEM of four independent experiments, considering five microphotographs per experiment. Friedman test followed by Dunn’s Multiple Comparison Test: *p<0.05; **p<0.01 as depicted by lines.

