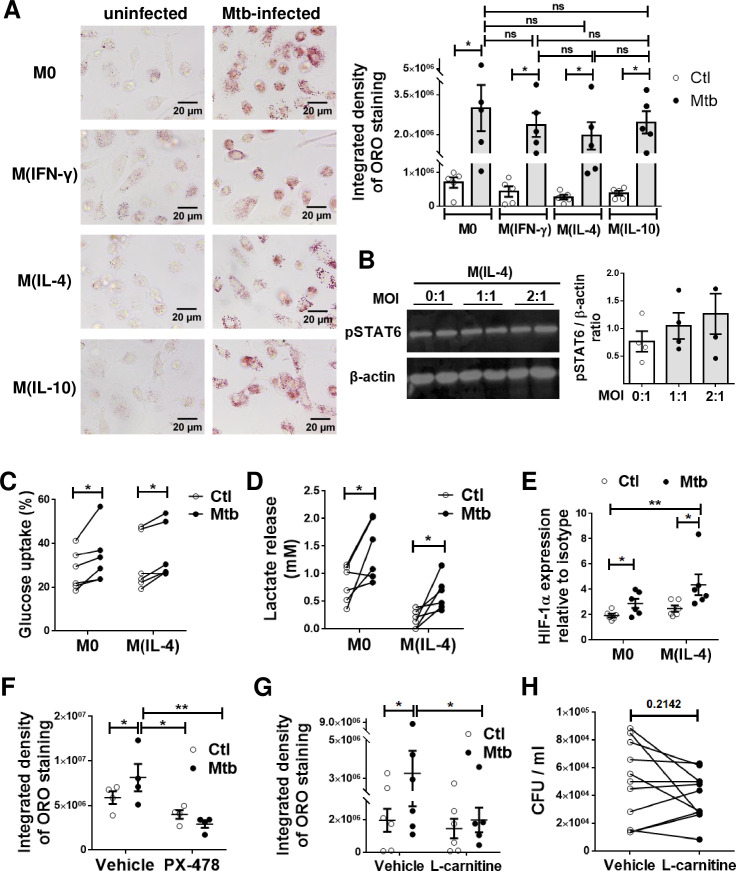
Fig 6. M(IL-4) cells are metabolically reprogrammed and become foamy upon Mtb infection.
(A) ORO staining of M0, M(IFN-γ), M(IL-4) and M(IL-10) macrophages infected or not with Mtb. Representative images are shown in left panels (40× magnification) and the integrated density of ORO staining is shown in right panels. Values are expressed as means ± SEM of five independent experiments, considering five microphotographs per experiment. (B) Analysis of pSTAT6 and β-actin protein expression level by Western Blot and quantification (n = 4) in M(IL-4) cells infected or not with different multiplicity of Mtb infection. (C-F) M0 and M(IL-4) macrophages were infected or not with Mtb and the following parameters were measured: (C), glucose consumption (n = 6), (D) lactate release (n = 6) and, (E) HIF-1α expression (n = 6). (F-G) ORO staining of M(IL-4) macrophages infected with Mtb and treated either with PX-478, a selective HIF-1α inhibitor (F) or with L-carnitine, a FAO enhancer (G). Values are expressed as means ± SEM of 6 independent experiments, considering five microphotographs per experiment. Friedman test followed by Dunn’s Multiple Comparison Test: *p<0.05; for experimental condition vs Ctl or as depicted by lines. (H) Intracellular colony forming units determined of M(IL-4) macrophages infected with Mtb and treated with L-carnitine at day 3 post infection.

