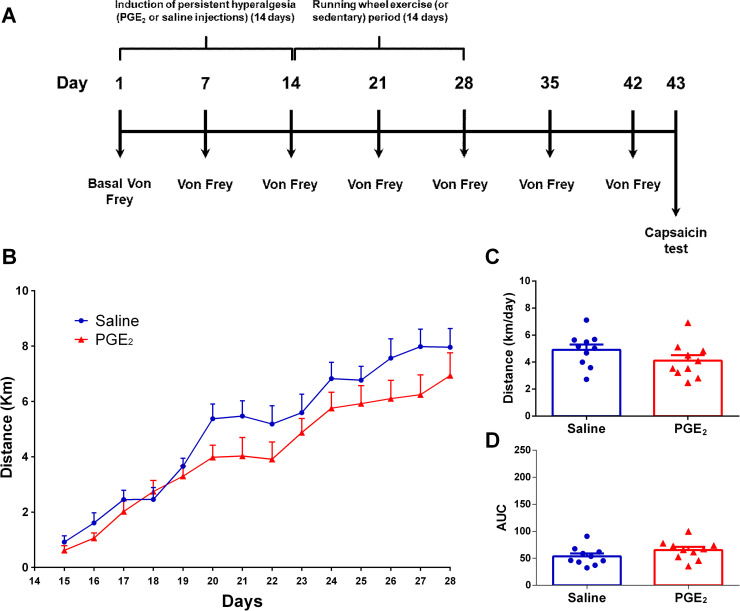
Fig 3. Mice activity on running wheel.
(A) Graphical diagram of the experimental design. In this experiment mice start running from 14d to 28d. (B) Average distance (km) traveled on each day over 14 days of running wheel free access. (C) Average distance (km) traveled per day on all 14 days of running wheel free access. (D) Area under the curve (AUC) for each group calculated from (A) data. There were no significant differences between the groups. Data are showed as mean ± SEM (N = 10 per group). Two-way ANOVA followed by Sidak posttests and multiple t tests (B); Unpaired t test (C) and (D).

