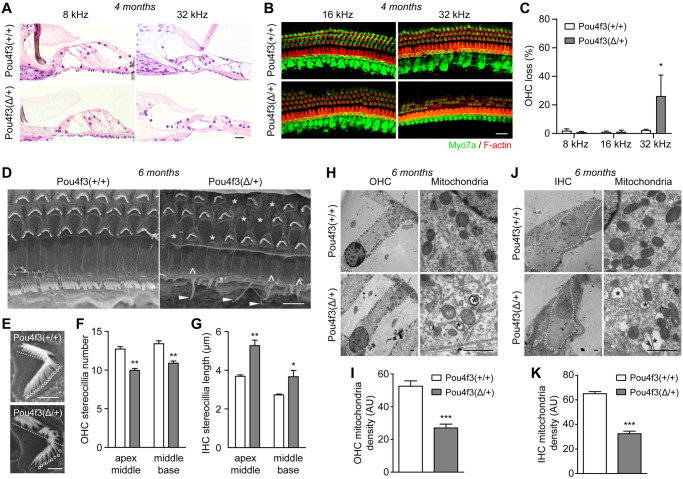
Fig 2. Pou4f3(Δ/+) mice display degeneration of outer hair cells and defects in stereocilia and mitochondria of the surviving hair cells.
(A) H&E staining images of organ of Corti plastic sections from 4 months old wildtype and Pou4f3(Δ/+) mice. (B) Myo7a immunostaining images of the cochlear sensory epithelia from 4 months old wildtype and Pou4f3(Δ/+) mice. Hair cells and F-actin was labelled with Myo7a (green) and Rhodamine-phalloidin (red), respectively. (C) Percentage of outer hair cell loss in wildtype and Pou4f3(Δ/+) mice. * P < 0.05 by two-way ANOVA, n = 4–5 cochleae of each genotype. (D) SEM images of middle-base turn cochlear sensory epithelia from 6 months old wildtype and Pou4f3(Δ/+) mice. Missing OHCs (*), fused stereocilia (^) and elongated stereocilia (arrow heads) of IHCs were indicated in Pou4f3(Δ/+) cochlea. (E) Evaluation of OHC stereocilia number in wildtype (top panel) and Pou4f3(Δ/+) cochleae (bottom panel). Half of the “V” shaped stereocilia bundles (bellow the dashed lines) and roots of the stereocilia were counted for each OHC (circles). (F) Quantification of OHC stereocilia density in both wildtype and Pou4f3(Δ/+) cochleae at two cochlear half turns (apex-middle and middle-base). ** P < 0.01 by unpaired student’s t-test, n = 10–23 images from 4 cochleae of each genotype. (G) Quantification of IHC stereocilia lengths in wildtype and Pou4f3(Δ/+) cochleae at the two cochlear half turns. * P < 0.05 and ** P < 0.01 by unpaired student’s t-test, n = 4–7 images from 4 cochleae of each genotype. (H, J) TEM images of OHCs (H) and IHCs (J) from 6 months old wildtype and Pou4f3(Δ/+) cochleae (middle turn). OHC or IHC was delineated with dashed lines. High magnification images showing mitochondria from OHC (H) or IHC (J) were also displayed. Asterisks (*) indicate vacuolization of the mitochondria. (I, K) Quantification of mitochondria density in (I) OHCs and (K) IHCs from wildtype and Pou4f3(Δ/+) cochleae. *** P < 0.01 by unpaired student’s t-test, n = 4–5 images from three mice of each genotype. Scale bars were 20 μm (A-B), 5 μm (D) and 1 μm (E, H, J).

