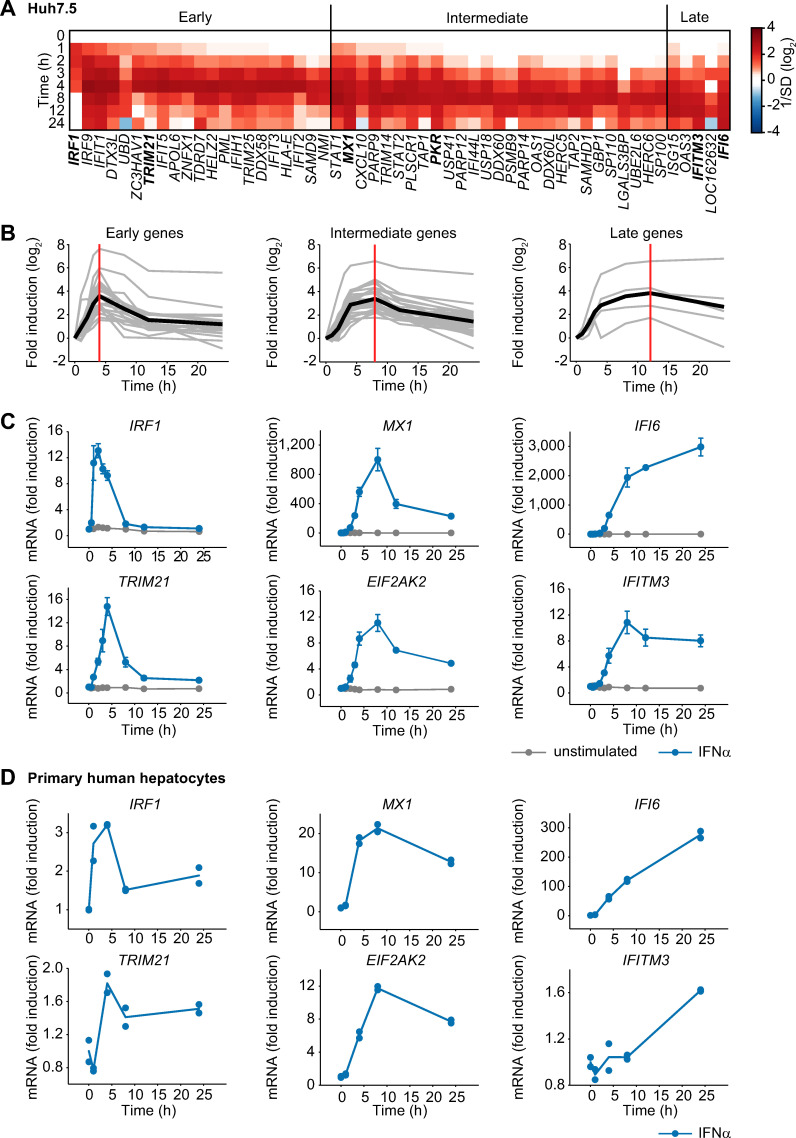
Fig 1. Early, intermediate and late expression profiles of IFNα-induced genes.
(A) Microarray expression data for Huh7.5 cells stimulated with 500 U/ml IFNα. The heatmap shows the temporal expression patterns of 53 significantly upregulated genes, grouped according to their peak expression time (tmax). Early transcripts show tmax ≤ 4 h, intermediate transcripts show tmax = 8 h and late transcripts show tmax ≥ 12 h. (B) The induction of the genes depicted in A is displayed in a time-resolved manner according to the respective groups (grey curves). The average expression of each group is indicated by a solid black line. The vertical red lines indicate the time points of maximal induction. (C) Huh7.5 cells were stimulated with 500 U/ml IFNα or left untreated and two representative antiviral genes per group were analyzed by qRT-PCR. The error bars represent SD of biological triplicates. (D) IFNα-induced mRNA expression in primary human hepatocytes. Primary human hepatocytes were growth factor depleted and stimulated with 500 U/ml IFNα. RNA was extracted at the indicated time points and analyzed using qRT-PCR. Points: experimental data; lines: average of duplicate measurements using primary human hepatocytes derived from one donor.

