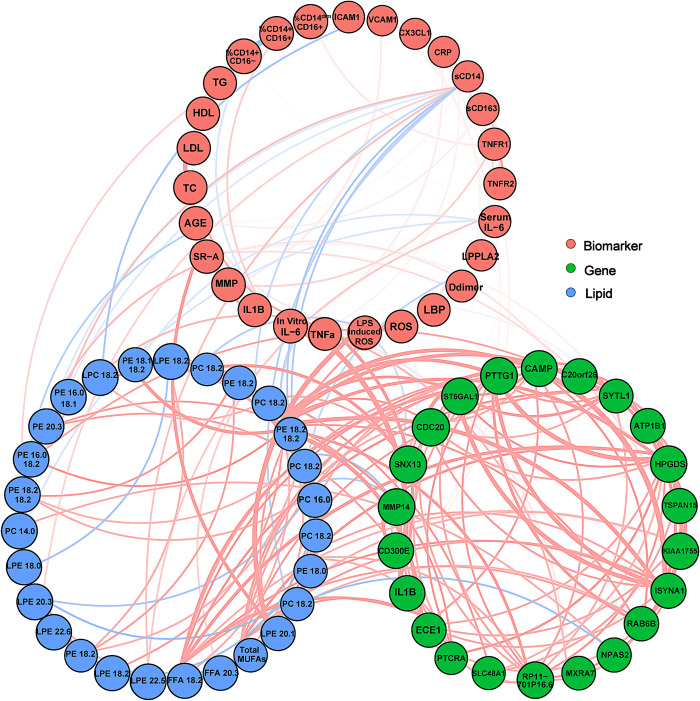
Fig 5. Transcriptomic, lipidomic and protein expression model.
We performed linear regression to identify genes, lipids and proteins that are most highly predictive for all three data types. The most highly interactive genes and lipids are displayed as nodes, with edges representing Pearson correlations between genes and lipids, and genes and biomarkers, as well as PCCs for actual gene-gene correlations. Because the lipid and gene data was so highly interactive, only edges with p-value < 0.01 and have an r-value > 0.5 were shown for clarity.

