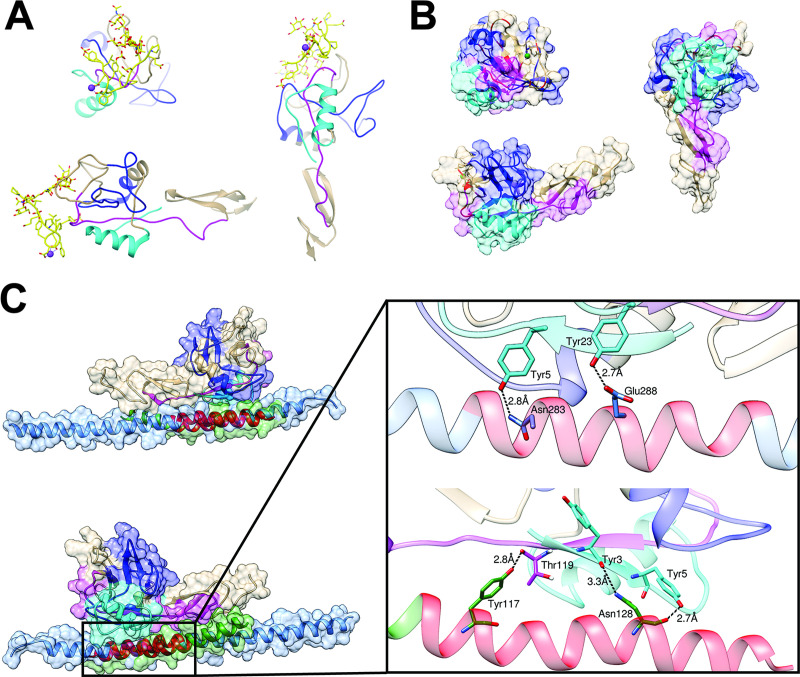
Fig 3. Three views of the crystallized lectin/EGF-domain of P-selectin showing the rhRod-binding regions based on the SPOT array.
P-selectin is shown (A) complexed with the binding region of PSGL-1, SGP-3 (yellow; PDB 1G1S) and (B) without SGP-3 (PDB 1G1Q). The rhRod-binding regions are highlighted based on the SPOT array (see S1 Table; cyan: SPOTs #14–16 (aa residues 43–65), blue: SPOTs #27–33 (aa residues 79–116), and magenta: SPOTs #50–51 (aa residues 148–170)). The rhRod binding regions overlap with where PSGL-1/SGP-3 interacts with P-selectin (ribbon regions highlighted in red). (C) Two views of the top in silico prediction model of rhRod (green) binding to P-selectin in the region correlating to aa residues 107–129 (Psel SPOT #31–42).

